Figures & data
Figure 1 (A) CircMORC3 was downregulated in HSCC tissues compared to paired adjacent normal tissues (n = 33, **P < 0.001). (B) CircMORC3 was downregulated in 84.8% (28/33) of HSCC patients compared to corresponding noncancerous tissues.
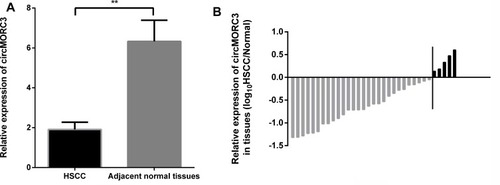
Table 1 Correlation Between circMORC3 Expression Levels and Clinicopathological Features of Hypopharyngeal Squamous Cell Carcinoma Patients (HSCCs)
Figure 2 (A) MORC3, the cognate mRNA of circMORC3, was downregulated in HSCC tissues compared to adjacent normal tissues (n = 33, ***P < 0.0001). (B) CircMORC3 and MORC3 were significantly correlated in HSCC tissues (r = 0.415, P = 0.016).
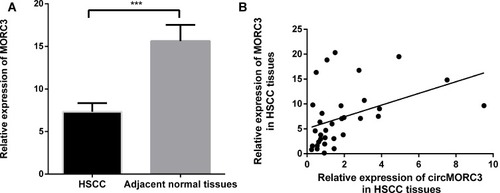
Figure 3 The diagnostic potential of circMORC3 in HSCC tissues. The area under the ROC curve (AUC) was 0.834 (95% confidence interval (CI): 0.737 to 0.931; P < 0.0001).
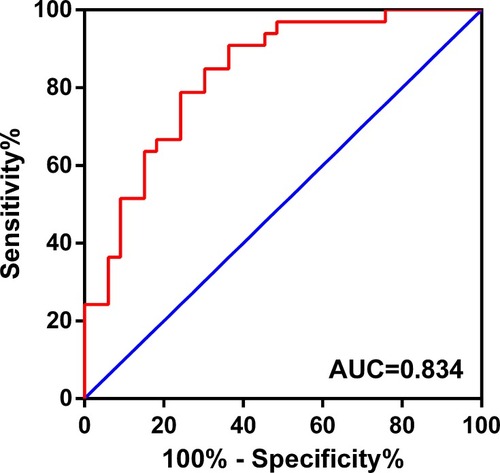
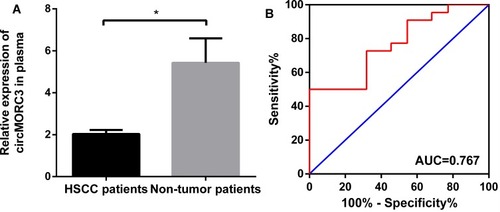
Figure 4 (A) Expression of circMORC3 was downregulated in HSCC plasma compared to non-tumor patients (n = 22, *P = 0.009). (B) The diagnostic value of circMORC3 in plasma. The area under the ROC curve (AUC) was 0.767 (95% confidence interval (CI): 0.627 to 0.906; P = 0.002).