Figures & data
Figure 1 Cell growth ability was suppressed by the knock-out of CCNY. (A) CRISPR/CAS9 technique was used to construct the CCNY knockout cell strains. Three different sgCCNYs (sgCCNY-1, sgCCNY-2, sgCCNY-3) were used. The left panel, the expression level of CCNY was detected by Western blot, with GADPH used as the internal loading controls. The right panel, the level of CCNY was quantified by gray analysis. *P<0.05 (t-test). (B) Three CCNY knock-out cell clones (CCNY cas9 clone-1, CCNY cas9 clone-2, CCNY cas9 clone-3) derived from cells infected by recombinant lentivirus with sgCCNY-3 were identified by Western blot. (C) Cell growth curve was determined by cell counts. The total number of cells were counted by Cellomics ArrayScan HCS Reader. **P<0.01 (t-test). (D) Colony formation efficiency of cells. The data are expressed as the mean ± standard error. **P<0.01 (t-test). (E) Soft-agar colony formation ability of cells. The data are expressed as the mean ± standard error. **P<0.01 (t-test).
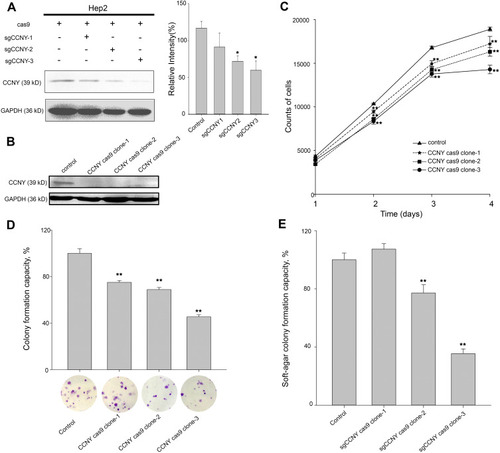
Figure 2 Cell proliferation was enhanced by the overexpression of CCNY. (A) CCNY was re-expressed in Hep2 cells by the infection of recombinant lentivirus. The left panel, the expression of CCNY was determined by WB. GAPDH is used as a loading control. The right panel, the level of CCNY was quantified by gray analysis. **P<0.01 (t-test). (B) Cells were subcultured in 96-well plates and an MTS assay was performed. Absorbance at 490 nm (y axis) was determined at every 24-hrs interval. The data are expressed as the mean ± standard error. **P<0.01 (t-test). (C) Colony formation efficiency of cells. The data are expressed as the mean ± standard error. *P<0.05 (t-test). (D) Soft-agar colony formation ability of cells. The data are expressed as the mean ± standard error. **P<0.01 (t-test).
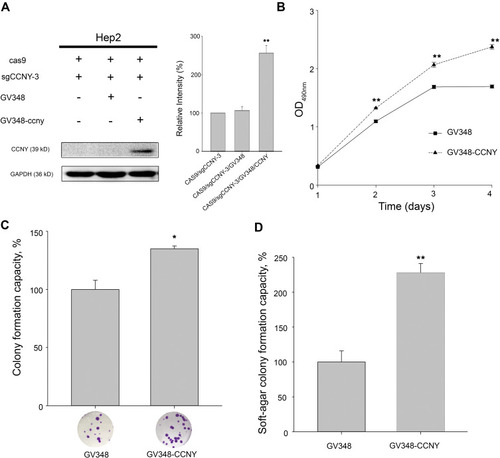
Figure 3 Cell cycle G1/S phase arrest was induced by the suppression of CCNY expression. Cell cycle distribution of cells was determined by flow cytometry. The histogram showed the statistical data expressed as the mean ± standard error. *P<0.05 (t-test), **P<0.01 (t-test).
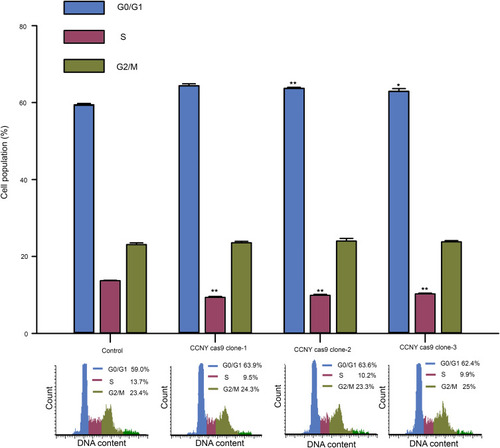
Figure 4 Cell cycle analysis. Cell cycle distribution of cells was determined by flow cytometry. The histogram showed the statistical data expressed as the mean ± standard error. *P<0.05 (t-test).
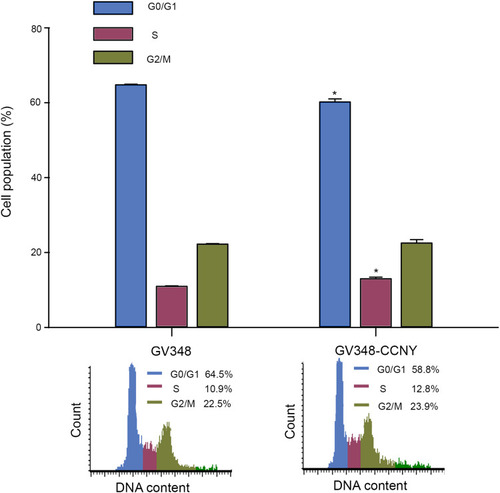
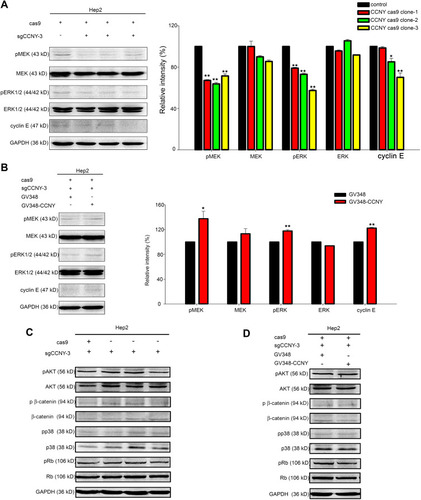
Figure 5 CCNY could induce cyclin E expression via MEK/ERK signaling pathway. (A and B) Western blot analysis of ERK1/2, MEK and their phosphorylated forms as well as cyclin E. GAPDH was used as internal loading controls. The levels of proteins were quantified by gray analysis as shown in the right panel. *P<0.05 (t-test), **P<0.01 (t-test). (C and D) The levels of pAKT, AKT, p β-catenin, β-catenin, pp38, p38, pRb, Rb were detected by Western blot. GAPDH was used as internal loading controls.