Figures & data
Figure 1 The illustration of the negative and positive CD56 expression.
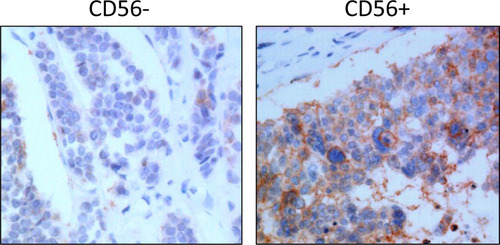
Table 1 Clinical Characteristics of Patients
Table 2 Immuohistochemical Evaluation in Pancreatic Neuroendocrine Neoplasms (PNENs)
Figure 2 The sizes of CD56+ and CD56- tumors in all pancreatic neuroendocrine neoplasms (PNENs) and PNEN grade 3 (PNEN G3).
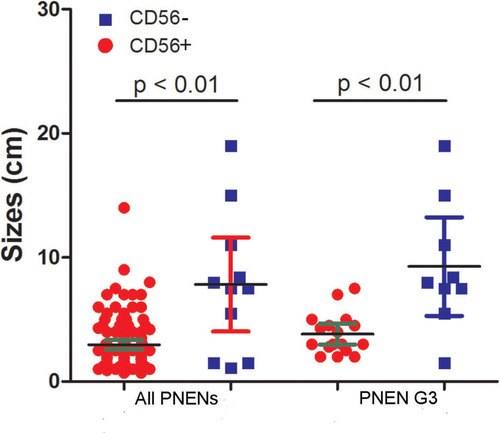
Table 3 Immuohistochemical Evaluation in Well-Differentiated (WD) Grade 3 Pancreatic Neuroendocrine Neoplasms (WD-G3 PNENs) and PNEC
Table 4 The Association Between Sizes, CD56 Negative Expression and PNENs Grade, Organs Invasion, Ki67 Index and NEC in PNEN G3
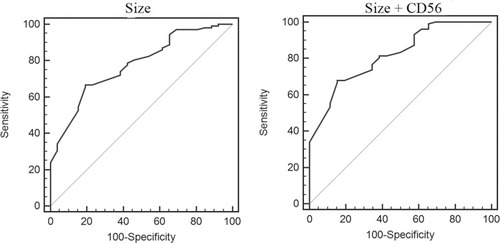
Figure 3 The receiver operating characteristic (ROC) curve of size and size+CD56 in differentiating pancreatic neuroendocrine neoplasms grade 3 (PNEN G3) from PNENs. The area under curve was 0.77 (95% CI: 0.71–0.85) for tumor size and 0.84 (95% CI: 0.74–0.89) for size+CD56 expression.