Figures & data
Table 1 Clinical Characteristics of Patients
Table 2 The Primers and Oligonucleotides Used in This Work
Figure 1 ENO1 facilitating cell proliferation was increased in oral squamous cell carcinoma (OSCC).
Notes: (A) ENO1 was knocked down, which was confirmed by real-time quantitative PCR. (B) Cell proliferation was inhibited by knocking down ENO1. (C) The expression of ENO1 by immunohistochemistry (IHC) staining in normal, OLP, and OSCC groups. (D) Semi-quantitative analysis demonstrated increased expression level of ENO1 in OSCC tissue compared to OLP. (E) Validation of increase in ENO1 expression through real-time quantitative PCR. t test: *p < 0.05, ***p < 0.001.
Abbreviations: NC, negative control; OLP, oral lichen planus; OSCC, oral squamous cell carcinoma; PCR, polymerase chain reaction.
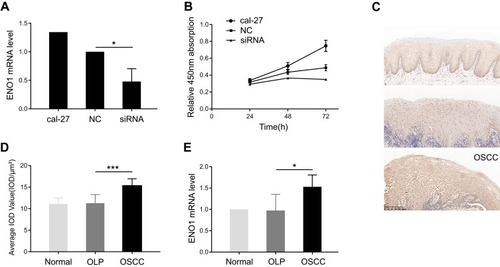
Figure 2 RNA-seq to explore the regulation network associated with ENO1.
Notes: Heat map showing differentially expressed noncoding RNAs (A) and mRNAs (B), when comparing OSCC with OLP. Red denotes high expression and blue denotes low expression. The transcriptome sequencing reveals 6734 differentially expressed mRNA genes (C), 3327 upregulateregulated and 3408 downregulateregulated; and 1985 differentially expressed ncRNAs (D), 608 upregulateregulated and 1377 downregulateregulated. (E) There is a highly positive correlation between the expression of circ-AMOTL1 and ENO1 in TCGA head and neck squamous cell carcinoma database. (F) Binding sites of ENO1 and miR-22-3p. (G) Binding sites of ENO1 and miR-1294. (H) Binding sites of circ-AMOTL1 and miR-22-3p. (I) Binding sites of circ-AMOTL1 and miR-1294.
Abbreviations: OLP, oral lichen planus; OSCC, oral squamous cell carcinoma.
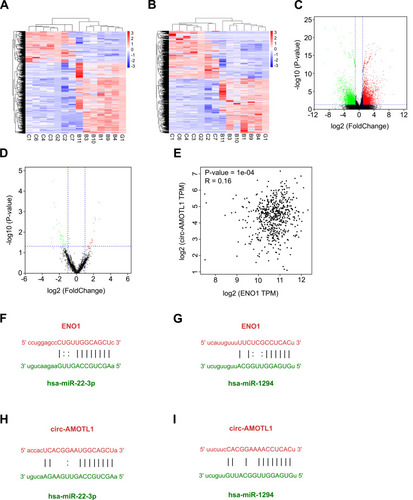
Figure 3 Circ-AMOTL1 increased in OSCC and regulated ENO1 positively.
Notes: (A) Knockdown efficiency of circ-AMOTL1 by sh-circ-AMOTL1 in the OLP cell model. (B) The expression of ENO1 in mRNA level after knocking down circ-AMOTL1. (C) Overexpression efficiency of circ-AMOTL1 by GV367 circ-AMOTL1 in the OLP cell model. (D) The expression of ENO1 in mRNA level after overexpression of circ-AMOTL1. (E) The circ-AMOTL1 expression is enhanced in OSCC samples in comparison with OLP in real-time quantitative PCR validation. (F–G) miR-22-3p and miR-1294 expression levels are decreased in OSCC. t test: *p < 0.05, **p < 0.01, ***p < 0.001.
Abbreviations: NC, negative control; OLP, oral lichen planus; OSCC, oral squamous cell carcinoma; PCR, polymerase chain reaction.
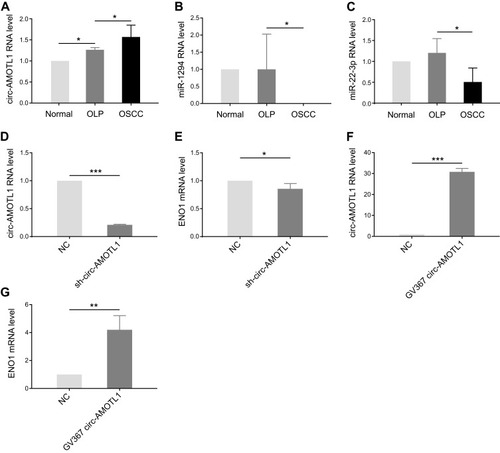
Figure 4 KEGG/GO enrichments.
Notes: The top 20 GO functional terms (A) and KEGG enrichments (B) are based on differential mRNAs of transcriptome sequencing using OSCC and OLP samples. The top 20 GO functional terms (C) and KEGG enrichments (D) are based on differential noncoding RNAs of transcriptome sequencing.
Abbreviations: GO, Gene Ontology; KEGG, Kyoto Encyclopedia of Genes and Genomes; OLP, oral lichen planus; OSCC, oral squamous cell carcinoma.
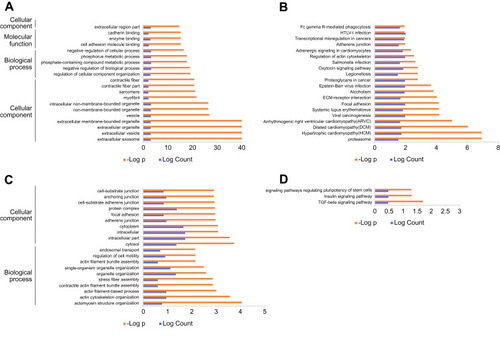
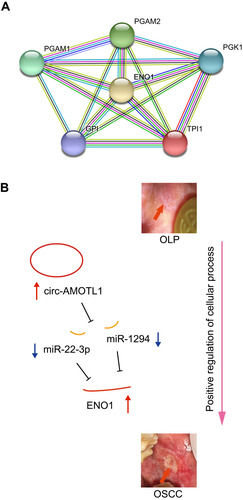
Figure 5 An ENO1 associated PPI network generated using the STRING database (A) and the hypothesis schematic diagram of the circ-AMOTL1/miR-22-3p/miR-1294/ENO1 ceRNA network during OSCC tumorigenesis (B).
Abbreviations: OLP, oral lichen planus; OSCC, oral squamous cell carcinoma; PPI, protein–protein interaction.