Figures & data
Table 1 Primers for Real-Time PCR
Figure 1 The miR-100-5p expression level was downregulated in chordoma tissues. (A) Heat-map representation of the differentially expressed miRNA patterns in chordoma (CH) versus nucleus pulposus tissues (N). Relative expression is presented as a color gram (red: high expression). (B–D) Bioinformatics analysis of biological processes, molecular functions, and biological pathways about dysregulated miRNAs. (E) Expression of miR-100-5p as determined by real-time RT-PCR analysis. A comparison of the average relative expression levels of miR-100-5p in chordoma and nucleus pulposus samples is shown in the Violin plot. **P < 0.01.
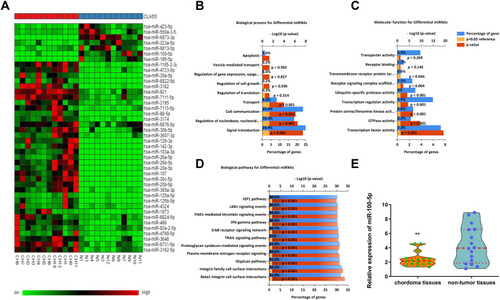
Figure 2 miR-100-5p suppressed cell proliferation in vitro and vivo. (A) Cell proliferation was evaluated by the CCK-8 assay at 24, 48, and 72 h. (B and C) miR-100-5p decreased both MUG and U-CH1 cell colony formation compared with control. (D and E) miR-100-5p induced apoptosis in chordoma cells. (F) The growth curves of the tumors. (G–I) Both tumor volume and weight were significantly decreased in the miR-100-5p agomir treatment group compared with the negative control group. All experiments were repeated three times. Data are presented as the mean ± S.D. **P < 0.01.
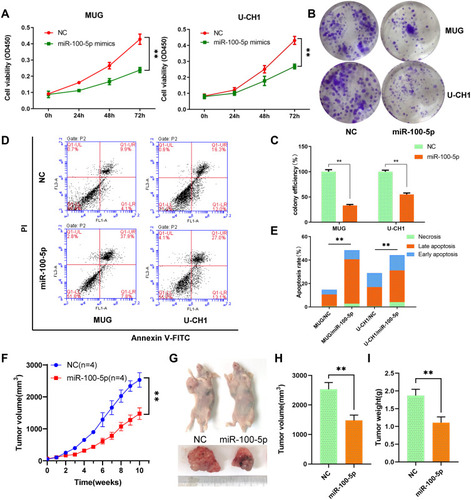
Figure 3 miR-100-5p suppressed the invasion and migration of chordoma cells. (A and B) Wound-healing assays were performed in chordoma cells transfected with miR-100-5p mimics or negative controls. (C and D) Transwell assays showed that migration and invasion ability of chordoma cells can be attenuated significantly by miR-100-5p mimics. (magnification 100X). (E and F) The mRNA and protein expression levels of E-cadherin, N-cadherin, and vimentin in chordoma cells transfected with miR-100-5p mimics or negative control were measured by qRT-PCR and Western blotting separately. (G) IHC results showed that miR-100-5p increased the expression of E-cadherin and decreased the expression of vimentin and N-cadherin in tumors formed by chordoma cells. All experiments were repeated three times. Data are presented as the mean ± S.D. *P < 0.05, **P < 0.01.
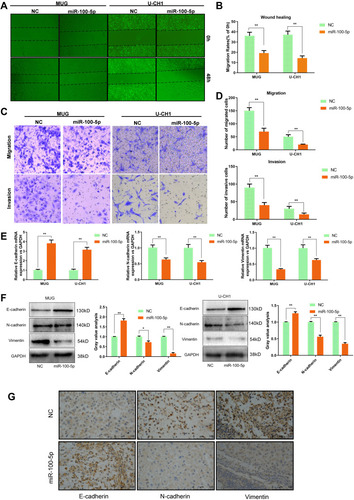
Table 2 The Expression of IGF1R in Chordoma Tissues
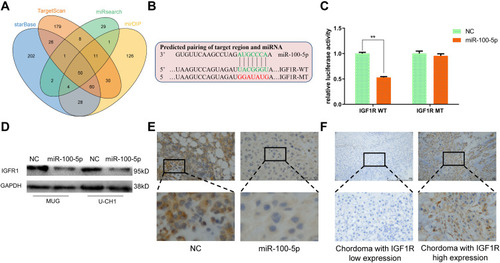
Figure 4 Identification of IGF1R as a target of miR-100-5p. (A) Venn diagram showed the comparison of targets of miR-100-5p predicted by TargetScan, miRsearch, starBase, and mirDIP. (B) Schematic representation of IGF1R 3ʹ-UTR containing the wild-type or mutant binding site for miR-100-5p. (C) Luciferase reporter activity following expression after transfection (negative control and miR-100-5p mimics) in U-CH1 cells. (D) Western blot analysis of IGF1R expression in miR-100-5p-overexpressed cells. (E) Representative IHC staining images of IGF1R expression in xenograft models. (F) Representative IHC staining images of IGF1R expression in chordoma tissues. All experiments were repeated three times. Data are presented as the mean ± S.D. **P < 0.01.