Figures & data
Figure 1 Paeonol inhibited cell viability and induced apoptosis in Hep3B and Huh-7 cells. (A–B) The cell viability of Hep3B and Huh-7 cells was detected by CCK-8 assay after treated with different concentrations of paeonol. (C–E) The apoptosis of Hep3B and Huh-7 cells was measured by flow cytometry assay after treated with varying concentrations of paeonol. (F–G) The expression levels of Cyclin D1, CDK4, Bcl-2 and Bax were determined by Western blot assay in paeonol-treated Hep3B and Huh-7 cells. *P < 0.05.
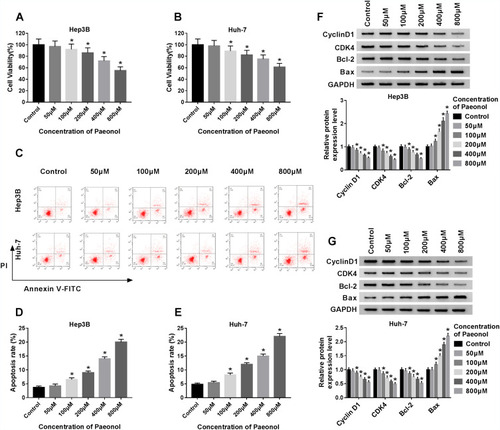
Figure 2 Paeonol suppressed cell migration and invasion in Hep3B and Huh-7 cells. (A–F) Transwell assay was conducted to assess cell migration and invasion in Hep3B and Huh-7 cells treated with various concentrations of paeonol for 24 h. (G and H) Western blot assay was performed to measure the expression of MMP2 and MMP9 in Hep3B and Huh-7 cells after treated with different concentrations of paeonol. *P < 0.05.
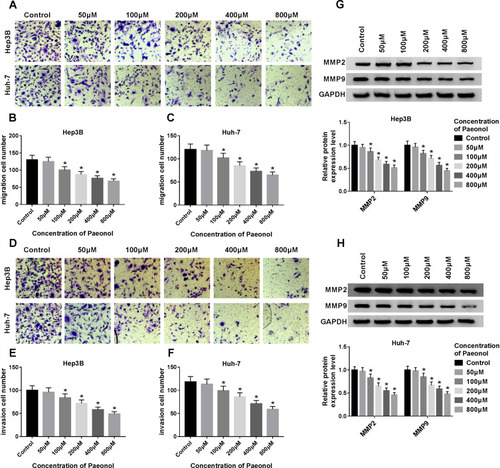
Figure 3 Paeonol down-regulated miR-21-5p level, and silencing of miR-21-5p inhibited cell viability, migration, invasion and promoted apoptosis in Hep3B and Huh-7 cells. (A) The expression of miR-21-5p was measured in Hep3B and Huh-7 cells treated with or without paeonol by qRT-PCR. (B) MiR-21-5p level was detected in Hep3B and Huh-7 cells transfected with NC inhibitor or miR-21-5p inhibitor by qRT-PCR. (C and D) Cell viability and apoptosis of Hep3B and Huh-7 cells were detected by CCK-8 or flow cytometry after transfected with NC inhibitor or miR-21-5p. (E and F) Transwell assay was conducted to assess the cell migration and invasion in transfected Hep3B and Huh-7 cells. (G and H) The expression of Cyclin D1, CDK4, Bcl-2, Bax, MMP2 and MMP9 was measured by Western blot assay in Hep3B and Huh-7 cells transfected with NC inhibitor or miR-21-5p inhibitor. *P < 0.05.
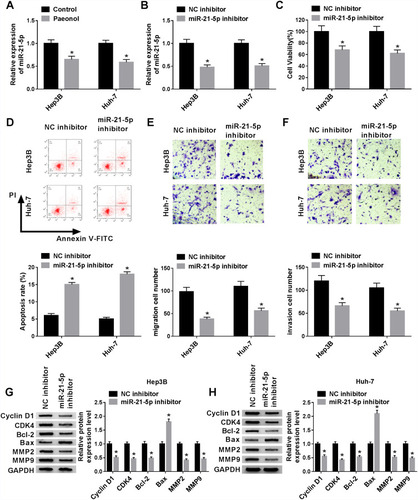
Figure 4 MiR-21-5p targeted KLF6 and down-regulated KLF6 expression. (A) The binding sites of miR-21-5p on KLF6 3ʹ-UTR and its mutant were shown. (B and C) Luciferase activity in Hep3B and Huh-7 cells transfected with NC mimic or miR-21-5p mimic was detected. (D) The level of miR-21-5p was detected by qRT-PCR in Hep3B and Huh-7 cells transfected with miR-NC and miR-21-5p mimic. (E) RNA pull-down was conducted to measure the enrichment of miR-21-5p in Hep3B and Huh-7 cells transfected with Bio-NC or Bio-KLF6. (F and G)The level of KLF6 was detected by Western blot assay in transfected Hep3B and Huh-7 cells. *P < 0.05.
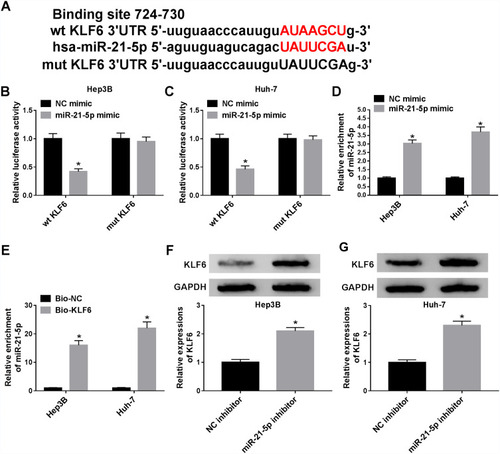
Figure 5 Knockdown of KLF6 relieved the effect of silenced miR-21-5p on cell viability, migration, invasion and apoptosis in Hep3B and Huh-7 cells. (A) The knockdown efficiency of KLF6 was determined by Western blot in Hep3B and Huh-7 cells introduced with si-NC or si-KLF6. Hep3B and Huh-7 cells were transfected with NC inhibitor, miR-21-5p + si-NC or miR-21-5p + si-KLF6. (B and C) Western blot was carried out to detect the KLF6 expression in transfected Hep3B and Huh-7 cells. (D and E) Cell viability and apoptosis were assessed by CCK-8 or flow cytometry, respectively. (F and G) Cell migration and invasion were examined by transwell assay in transfected Hep3B and Huh-7 cells. (H and I) The levels of Cyclin D1, CDK4, Bcl-2, Bax, MMP2 and MMP9 were determined by Western blot in transfected Hep3B and Huh-7 cells. *P < 0.05.
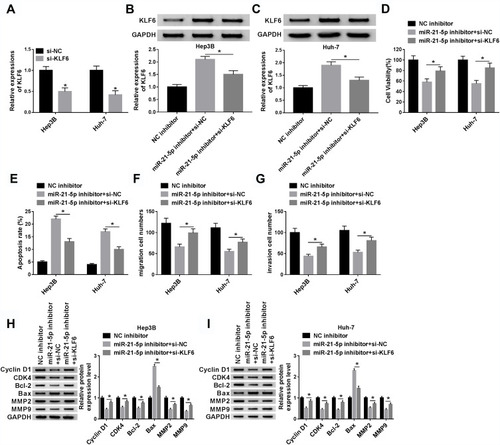
Figure 6 Paeonol attenuated miR-21-5p-mediated inhibitory effect on KLF6 level in Hep3B and Huh-7 cells. (A and B) The expression level of KLF6 was assessed by Western blot assay in Hep3B and Huh-7 cells transfected with NC mimic, miR-21-5p mimic or miR-21-5p + paeonol. *P < 0.05.
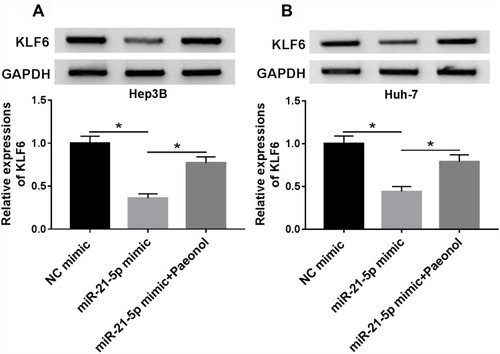
Figure 7 Paeonol treatment impeded the cell cycle at the G1 to S transition. After incubation with paeonol (50 µM or 800 µM), cell cycle of Hep3B and Huh-7 cells was monitored by flow cytometry. (A and B) The statistics of cell number in G1 and S stages were shown. *P < 0.05.
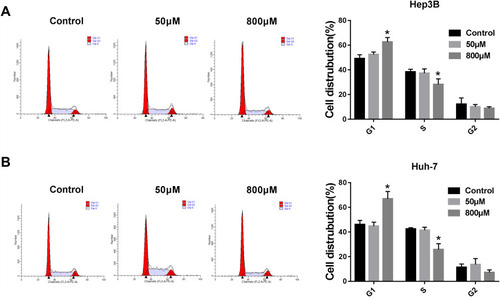
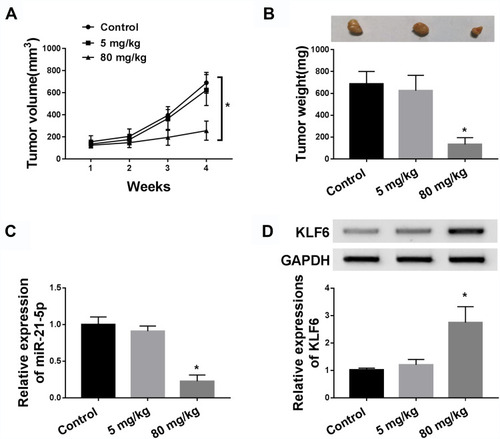
Figure 8 Administration of paeonol blocked tumor growth in xenograft mice. BALB/c mice were subcutaneously injected with Hep3B cells and treated with paeonol (50 µM or 800 µM). (A) Tumor volume was measured every 7 d. (B) Tumor weight was examined after mice were sacrificed. (C) The expression of miR-21-5p was determined by qRT-PCR. (D) The protein expression of KLF6 was detected by Western blot assay. *P < 0.05.