Figures & data
Figure 1 Baohuoside I inhibits cell proliferation of U251. (A) RTCA proliferation analysis of U251 cells treated with 0, 20 and 50 μM Baohuoside I. (B) CCK-8 assays of U251 cells treated with 0, 20 and 50 μM Baohuoside I for 24 h. (C) Ki67 immunofluorescence staining of U251 cells treated with 0, 20 and 50 μM Baohuoside I for 24 h. (D) Histogram representing the Ki67 positive rate of U251 cells in each group. (E) Colony formation experiment of U251 cells treated with 0.20 and 50 μM Baohuoside I. (F) Histogram representing the colony formation assays of U251 cells in each group. All experiments were repeated 3 times and data are presented as mean ± SD. *p < 0.05, ***p < 0.001, ****P < 0.0001, compared with control groups.
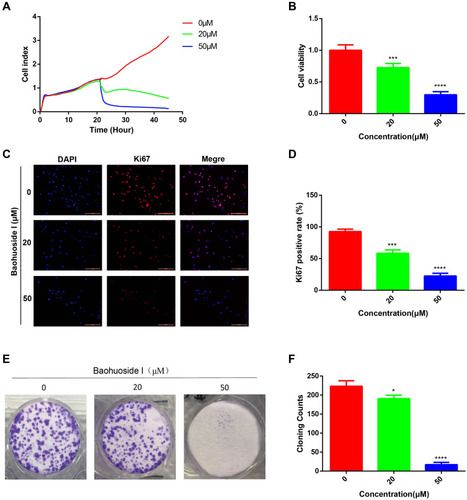
Figure 2 Baohuoside I inhibits the invasion and migration of U251 cells. (A) Wound-healing assays of U251 cells treated with Baohuoside I for 24 h. (B) Histogram representing the wound-healing assays of U251 cells in each group. (C) Transwell assays of U251 cells treated with Baohuoside I for 24 h. (D) Histogram representing the Transwell assays of U251 cells in each group. All experiments were repeated 3 times and data are presented as mean ± SD. ***p < 0.001, ****P < 0.0001, compared with untreated group.
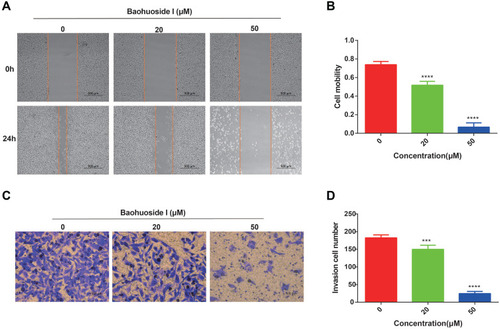
Figure 3 Baohuoside I promotes apoptosis of U251 cells. (A) Flow cytometry analysis of U251 cells after 24 h treated with 0, 20 and 50 μM Baohuoside I. (B) Histogram of flow analysis in each group. (C) Western blot analysis of apoptosis-related proteins. (D) Histogram representing the relative protein expression level of p62. (E) Histogram representing the relative protein expression level of LC3-I. (F) Histogram representing the relative protein expression level of LC3-II. (G) Histogram representing the relative protein expression level of Bcl-2. (H) Histogram representing the relative protein expression level of Bax. (I) Histogram representing the relative protein expression level of cleaved caspase 3. (J) Histogram representing the relative protein expression level of cleaved caspase 8. All experiments were repeated 3 times and data are presented as mean ± SD. *p < 0.05, ***p < 0.001, ****P < 0.0001, compared with untreated cells.
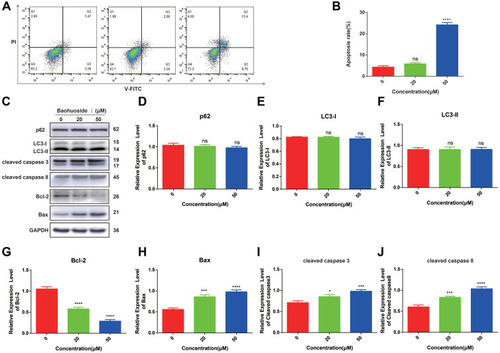
Figure 4 Baohuoside I inhibits the activity of mTOR signaling. (A and D) Western blot analysis of protein expression level in U251 cells treated with 0, 20 and 50 μM Baohuoside I for 24 h. (B) Histogram representing the ratio of p-JAK2/JAK2. (C) Histogram representing the ratio of p-mTOR/mTOR. (E) Histogram representing the ratio of p-AMPKα1/AMPKα1. (F) Histogram representing the ratio of p-p70/p70. All experiments were repeated 3 times and data are presented as mean ± SD. *p < 0.05, **P < 0.01, ****P < 0.0001, compared with untreated cells.
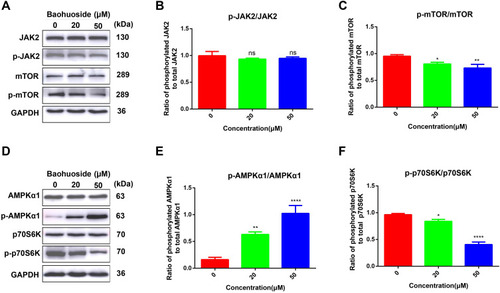
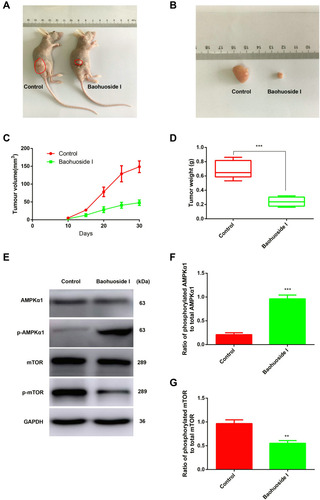
Figure 5 Baohuoside I inhibits the growth of glioma in vivo. (A and B) U251 cells were subcutaneously injected into nude mice. At the end of the assay, tumors were removed and photographed. (C) Tumor volume was detected at various time points. (D) Tumor weight was determined after tumors were removed. (E-G) Western blot analysis of protein expression. All experiments were repeated 3 times and data were presented as mean ± SD. **P < 0.01, ***P < 0.001, compared with control group.