Figures & data
Figure 1 Workflow of radiomics analysis.
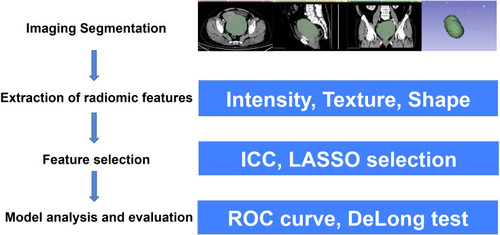
Table 1 The Patient Characteristics of SBOTs and SMOTs
Table 2 The Most Predictive Features Between SBOTs and SMOTs Selected by LASSO Regression
Figure 2 The ROC curves and AUC values of the most predictive features between SBOTs and SMOTs with LASSO regression in AP (A), VP (B), and EP (C). The numbers in each figure mean the radiomics parameters in.
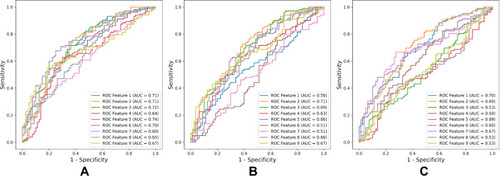
Figure 3 The heat maps of radiomics parameter distribution of the AP, VP and EP between SBOTs and SMOTs. Difference in colors means different value of radiomics parameter.
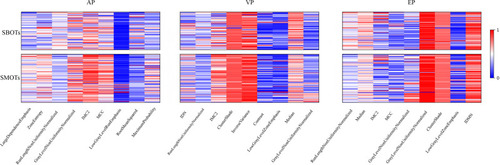
Table 3 The Predictive Performance of AP, VP, and EP Model
Table 4 The Results of Multiple Comparisons of the AUCs by the Delong Test
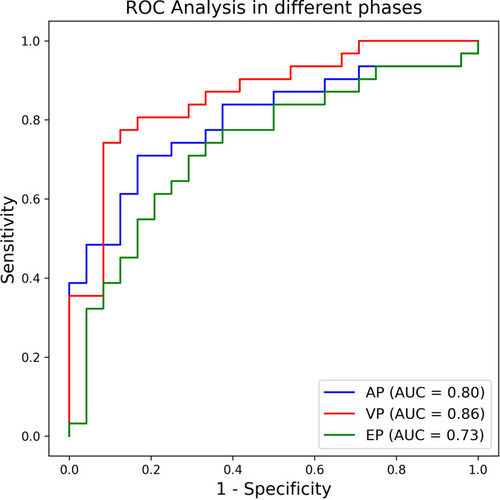
Figure 4 The ROC curves and AUC values of the AP, VP, and EP to differentiate SBOTs and SMOTs.