Figures & data
Figure 1 KLF16 is highly expressed in BC specimens. (A) The levels of KLF16 transcript were evaluated in 404 of bladder urothelial carcinoma (BLCA) and 28 normal samples from the TCGA database, p<0.05. (B) Immunohistochemical staining of KLF16 in 12 pairs of BC and normal samples. The quantitative result is presented. ***p<0.001. (C) qRT-PCR detection of KLF16 in SV-HUC-1, T24, 5637, and RT-4 cells. The expression of KLF16 was adjusted to β-actin expression. *p<0.05. **p<0.01. (D) BLCA patients were grouped into high- and low-expression KLF16 groups according to TCGA database. Overall survival was analyzed in the patients. p=0.013.
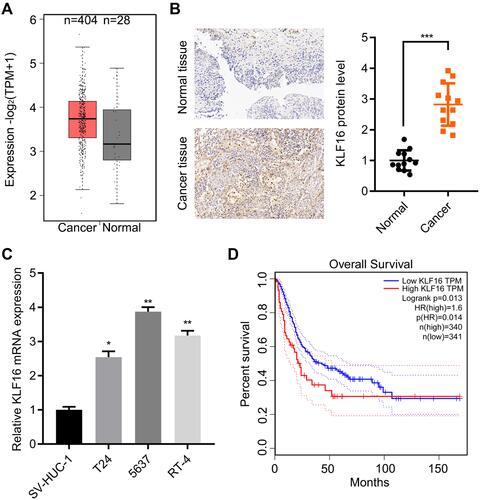
Figure 2 KLF16 is essential for BC cell growth and migration. (A) Immunoblotting analysis of KLF16 in siCtrl, siKLF16#1 and siKLF16#2-transfected 5637 and T24 cells. Expression of KLF16 was adjusted to GAPDH expression. (B) Cell proliferation was examined in siCtrl, siKLF16#1, and siKLF16#2-treated 5637 and T24 cells. siCtrl vs siKLF16#1 **p<0.01 and siCtrl vs siKLF16#1 ***p<0.001, siCtrl vs siKLF16#2 ##p<0.01, siCtrl vs siKLF16#2 ###p<0.001. (C) Colony growth was evaluated in siCtrl, siKLF16#1, and siKLF16#2-treated 5637 and T24 cells. **p<0.01, ***p<0.001. (D and E) Cell apoptosis was detected by PI/Annexin V staining in siCtrl, siKLF16#1 and siKLF16#2-treated 5637 and T24 cells, respectively. ***p<0.001. (F) Cell migration was assessed using Transwell assays using 5637 and T24 cells exposed to siCtrl, siKLF16#1, and siKLF16#2, respectively. **p<0.01, ***p<0.001.
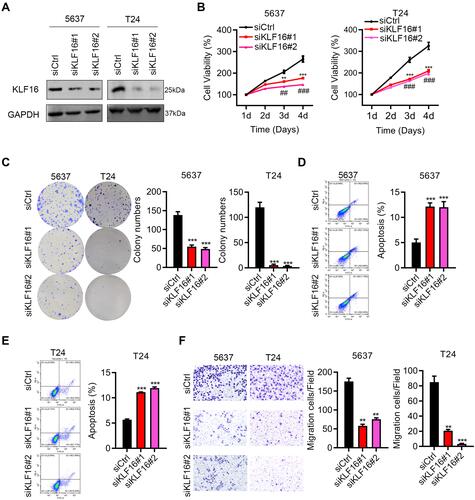
Figure 3 Overexpression of KLF16 promoted BC cell growth and migration. (A) Immunoblot analysis of KLF16 in 5637 and T24 cells overexpressing Ctrl and KLF16. Expression of KLF16 was adjusted to GAPDH expression. (B) Cell proliferation was examined in 5637 and T24 cells overexpressing Ctrl and KLF16. **p<0.01, ***p<0.001. (C) Colony growth was evaluated in 5637 and T24 cells overexpressing Ctrl and KLF16. **p<0.01, ***p<0.001. (D and E) Cell apoptosis was detected by PI/Annexin V staining in Ctrl and KLF16 overexpressing 5637 and T24 cells. ***p<0.001. (F) Cell migration was detected by the Transwell assay in 5637 and T24 cells overexpressing Ctrl and KLF16. **p<0.01, ***p<0.001.
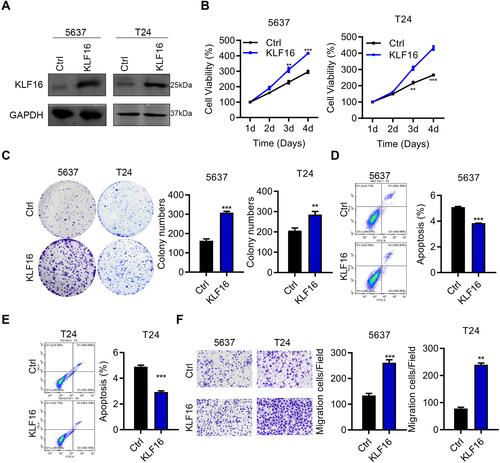
Figure 4 KLF16 negatively regulates TGFBR3 by inhibiting its transcriptional activity. (A and B) mRNA and protein were determined by qRT-PCR and immunoblotting and normalized to β-actin in KLF16 silencing and overexpressing cells. (C) 293T cells were transfected with pCDNA3.1-Ctrl or pCDNA3.1-KLF16, pGL3. Basic-TGFBR3 promoter, and TK vectors. 48 hours later, dual luciferase activity was assessed and adjusted for TK. **p<0.01. (D) The ChIP-qPCR assay was performed in T24 and 5637 cells overexpressing KLF16-flag. Relative enrichment was adjusted to the IgG group. **p<0.01. (E) TGFBR3 transcript levels in 404 BC and 28 normal samples were assessed using datasets obtained from TCGA database. *p<0.05. (F) Spearman correlation between KLF16 and TGFBR3 was analyzed in BLCA samples from TCGA database. p<0.0001.
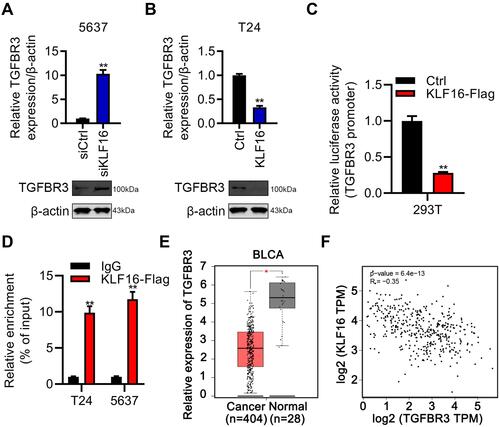
Figure 5 Downregulation of TGFBR3 by KLF16 contributes to BC growth and migration. (A–D) T24 cells were transfected with lentivirus overexpressing Ctrl, KLF16, and KLF16+TGFBR3. The cells were subjected to immunoblotting analysis of TGFBR3 (A), CCK8 assay (B), Transwell assay (C), and PI/Annexin V-FITC staining of apoptosis (D). Quantification results were presented. **p<0.01. (E–H) 5637 cells were transfected with siRNAs against Ctrl, KLF16 and KLF16+TGFBR3. The cells were subjected to immunoblotting analysis of TGFBR3 (E), CCK8 assay (F), colony formation (G), and Transwell assay (H). Quantification results were presented. **p<0.01.
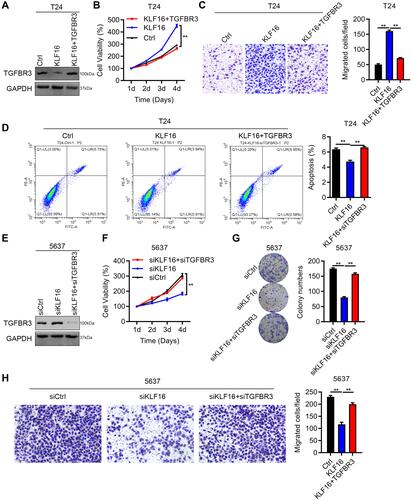
Figure 6 Downregulation of TGFBR3 by KLF16 promotes BC tumorigenesis. (A) Macroscopic images of xenografted tumors of T24 cells transfected with the lentivirus Ctrl (negative control), KLF16 (KLF16 overexpression), and KLF16+TGFBR3 (KLF16 and TGFBR3 overexpression) lentivirus. (B) Tumor growth was evaluated on day 14 after implantation. ns, not significant. **p<0.01. (C) Tumors were weighed on day 36 after implantation. **p<0.01. (D) qRT-PCR analysis of KLF16, TGFBR3, and PCNA in tumors. *p<0.05.
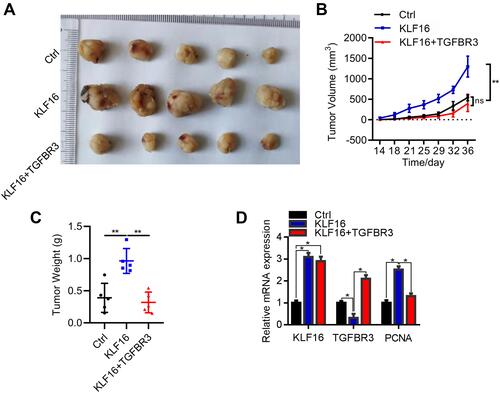
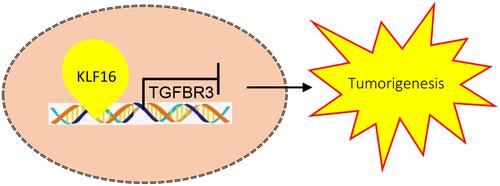
Figure 7 The schematic mechanisms of KLF16 promotes BC proliferation and migration via downregulating TGFBR3.