Figures & data
Figure 1 Representative 1H-NMR spectra (δ9.5-δ0.5) of serum samples of different groups at 600 MHz Normal control; 7 days after administration; 14 days after administration; 21 days after administration.
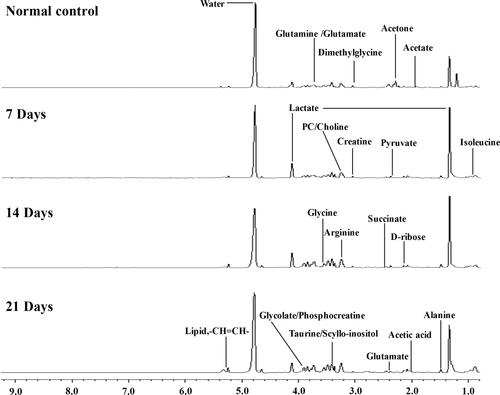
Figure 2 Metabolomics analysis of serum samples of the normal and metastasis groups (A) PCA scores plot between the metastatic groups and normal control; (B) PLS-DA scores plot between the metastatic groups and normal control; (C) OPLS-DA scores plot between the metastatic groups and normal control; (D) The PLS-DA model was statistically verified by permutation analysis (200 times). R2 represents explained variance, and Q2 represents the predictive ability of the model.
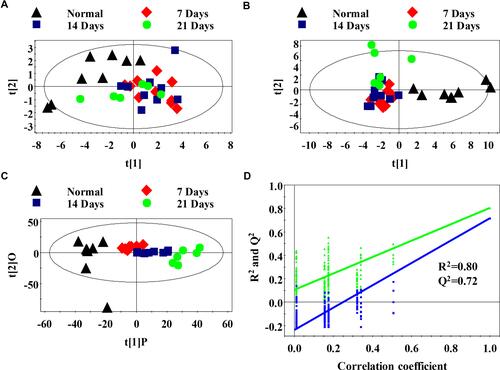
Figure 3 Serum PR analysis of different metastasis groups and normal control group (A) OPLS-DA model was used to process score plots based on the normal group and each metastasis group; (B) statistical validation of PLS-DA model by permutation analysis (200 times). R2 represents explained variance, and Q2 represents the predictive ability of the model.
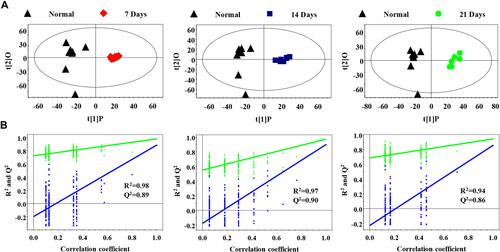
Table 1 Summary of Different Serum Metabolites Between Metastasis Groups and Normal Group
Figure 4 Box-and-whisker plots show differences between the normal control group and the metastatic groups. The Y-axis shows the relative abundance of the NMR signal (normalized to the total peak); median: horizontal line in the middle portion of the box; lower and upper quartile: bottom and top boundaries of boxes; whiskers, 5th and 95th percentiles; outliers: open circles; *p < 0.05, **p < 0.01, ***p < 0.001, unpaired Student’s t-test.
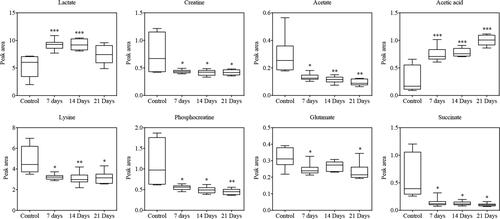
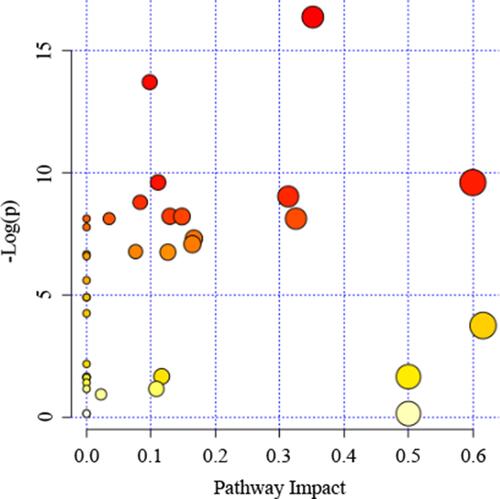
Table 2 Pathway Enrichment
Figure 5 Summary of pathway analysis by Metaboanalyst online. The further its location is from the (0,0), the more significant the pathway is.