Figures & data
Figure 1 LRT plan. Upper left: dose distribution in an axial plane. Upper right: peak-valley dose profiles defined by the red line across the two dose vertices. Lower left: dose distribution in a coronal plane. Lower right: peak-valley dose profiles defined by the red line across the two dose vertices. The dose profiles contain individual arcs (lower 4 curves) and combined-arcs (upper curve).
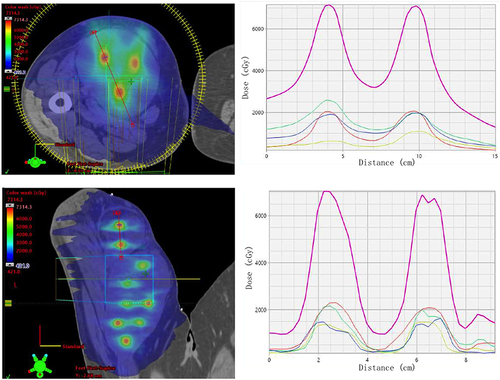
Figure 2 LRT↓EBRT delivery sequence.
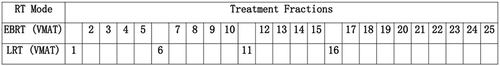
Figure 3 Tumor size changes over the course of induction RT. X: maximal lateral dimension; Y: maximal vertical dimension.
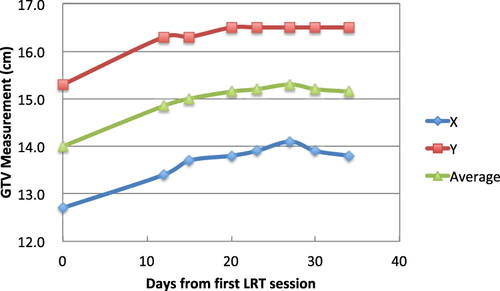
Figure 4 H&E Histomicrographs. (A) (200X) shows tumor ghost cells (devoid of nuclei with area demonstrating infiltrating lymphocytes). (B) (100X) shows extensive fibrosis and tumor cells undergoing apoptosis with occasional infiltrating lymphocytes. No obvious viable tumor cells are seen in both H&E slides.
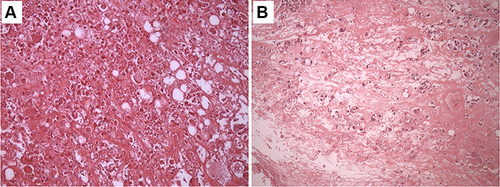
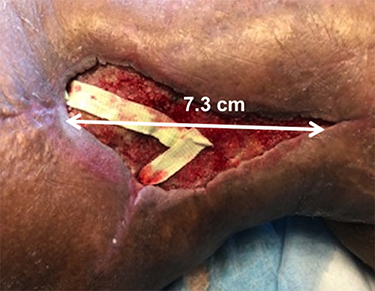
Figure 5 Tumor bed two weeks post surgery.