Figures & data
Table 1 Clinical Characteristics of the Study Population and Their Comparisons
Table 2 Comparisons of Clinical Characteristics in Different Clinical Stages of NPC
Table 3 Multivariate Linear Regression Analyses of Factors Associated with Serum AURKA Levels
Table 4 Multivariate Logistic Analyses of Factors for NPC Diagnosis
Figure 1 Nomogram for diagnosis of NPC.
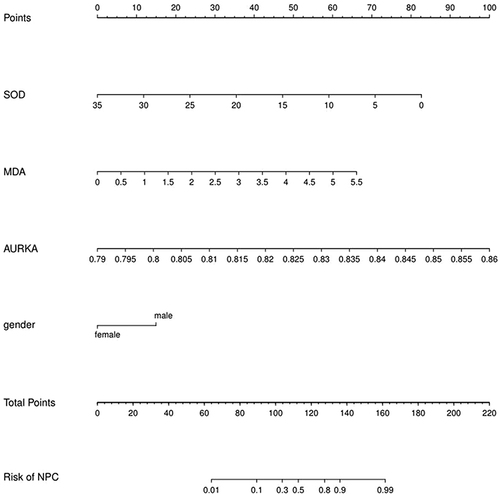
Figure 2 Decision curve analysis of the nomogram. (A) the validation cohort; (B) the traning cohort.
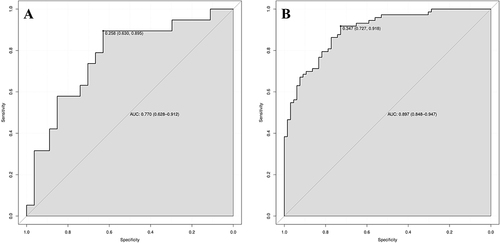
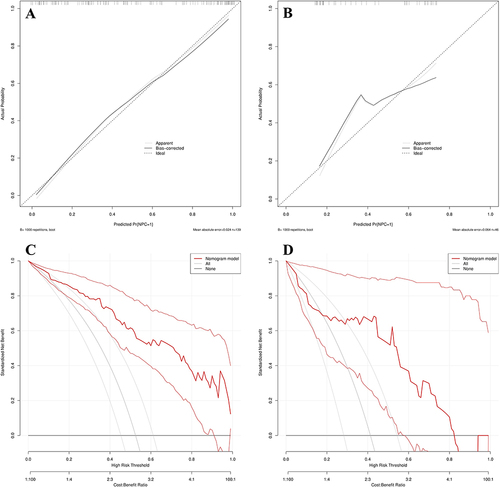
Figure 3 Calibration and DCA curve of the nomogram. (A) Calibration curve of the training cohort; (B) Calibration curve of the validation cohort, the dashed line represents the original performance, and the solid dashed line represents the performance during validation by bootstrapping (B = 1000 repetitions). (C) DCA curve of the training cohort; (D) DCA curve of the validation cohort. None: All patients receive no specific intervention, representing the scenario where the Nomogram model is not applied for prediction, indicating that all patients are not diagnosed with NPC. ALL: The predictive results of the Nomogram model are used to intervene in all patients, representing the scenario where all patients are diagnosed with NPC. The red line illustrates the net benefit of the Nomogram model relative to the default strategy at different threshold probabilities.