Figures & data
Figure 1 Differential expression analysis of PSMC1 (A), PSMC2 (B), PSMC3 (C), PSMC4 (D), PSMC5 (E), and PSMC6 (F) in HCC tissues compared to normal liver tissues in TCGA. Paired differential expression analysis of PSMC1 (G), PSMC2 (H), PSMC3 (I), PSMC4 (J), PSMC5 (K), and PSMC6 (L) in HCC tissues compared to matched normal adjacent tissues in TCGA. Expression patterns of PSMCs in different HCC cell lines (M).
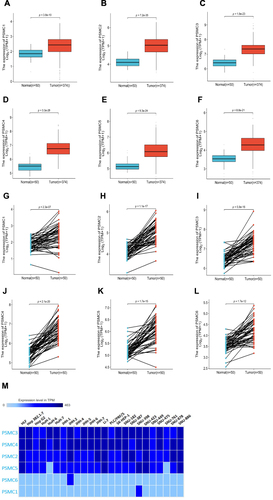
Figure 2 Immunohistochemical analysis showing different protein expression levels of PSMC1 (A), PSMC2 (B), PSMC3 (C), PSMC4 (D), PSMC5 (E), and PSMC6 (F) in HCC tissues. All representative IHC staining images are from the HPA server.
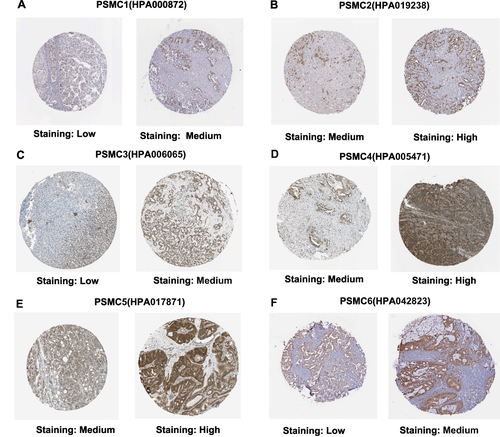
Figure 3 Kaplan-Meier overall survival curves in HCC from the TCGA consortium depicts; (A) PSMC1 expression; PSMC1 high versus PSMC1 low (B) PSMC2 expression; PSMC2 high versus PSMC2 low (C) PSMC3 expression; PSMC3 high versus PSMC3 low (D) PSMC4 expression; PSMC4 high versus PSMC4 low (E) PSMC5 expression; PSMC5 high versus PSMC5 low (F) PSMC6 expression; PSMC6 high versus PSMC6 low. Kaplan-Meier overall survival curves in HCC from the Kaplan-Meier Plotter depict; (G) PSMC1 expression; PSMC1 high versus PSMC1 low (H) PSMC2 expression; PSMC2 high versus PSMC2 low (I) PSMC3 expression; PSMC3 high versus PSMC3 low (D) PSMC4 expression; PSMC4 high versus PSMC4 low (J) PSMC5 expression; PSMC5 high versus PSMC5 low (K) PSMC6 expression; PSMC6 high versus PSMC6 low (L).
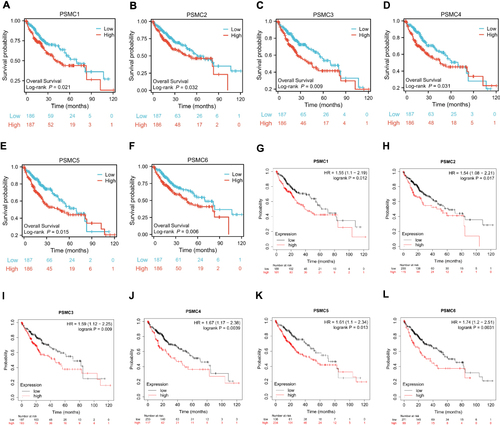
Figure 4 Relationship between DNA methylation and PSMC gene expression (A–F) in HCC. Kaplan-Meier survival curves display the overall survival of HCC patients with high PSMC1 methylation compared to low PSMC1 methylation (G), high PSMC2 methylation compared to low PSMC2 methylation (H), high PSMC3 methylation compared to low PSMC3 methylation (I), high PSMC4 methylation compared to low PSMC4 methylation (J), high PSMC5 methylation compared to low PSMC5 methylation (K), and high PSMC6 methylation compared to low PSMC6 methylation (L).
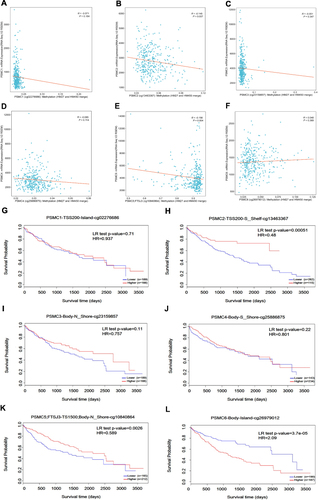
Figure 5 Mutation analysis report on PSMC genes in HCC patients from cBioPortal (A). Relationship between CNA and the expression levels of PSMC1 (B), PSMC2 (C), PSMC3 (D), PSMC4 (E), PSMC5 (F), and PSMC6 (G) in HCC. The gene expression correlations between PSMC family members in HCC (H).
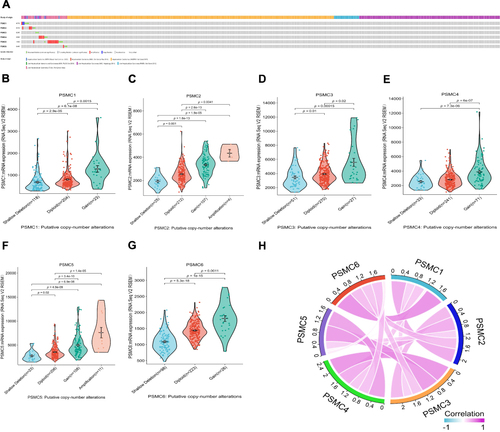
Figure 6 Top positively co-expressed genes of PSMC1 (A), PSMC2 (B), PSMC3 (C), PSMC4 (D), PSMC5 (E), and PSMC6 (F) in HCC tissues obtained from the cBioPortal. The enriched gene ontology terms of the 1369 common co-expressed genes of PSMCs in HCC tissues: (G) biological processes, (H) molecular function, (I) cellular component, and (J) KEGG pathway.
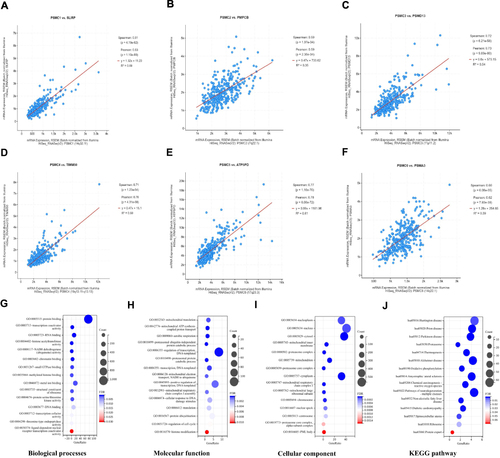
Figure 7 Association between the PSMC expression and the infiltration levels of immune cells (A–F) in HCC tissues identified in the TCGA database. Relationship between the PSMC gene expression and the immunomodulatory factors (G–L) in HCC tissues identified in the TCGA database. *p < 0.05, **p < 0.01, and ***p < 0.001.
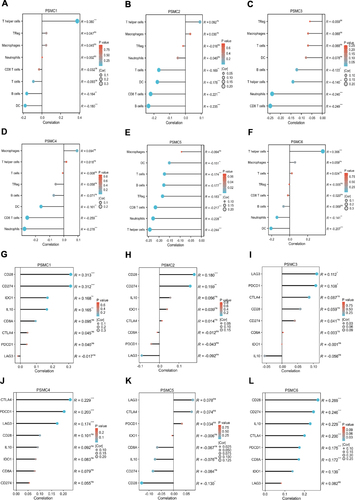
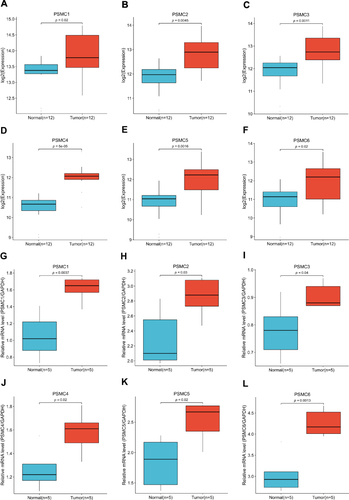
Figure 8 Expression pattern of the PSMC genes in HCC tissues (n = 12) and adjacent normal liver tissues (n = 12) obtained from the GSE147888 dataset: PSMC1 (A), PSMC2 (B), PSMC3 (C), PSMC4 (D), PSMC5 (E), and PSMC6 (F). Quantitative real-time PCR verification of the expression pattern of the PSMC genes in HCC tissues: PSMC1 (G), PSMC2 (H), PSMC3 (I), PSMC4 (J), PSMC5 (K), and PSMC6 (L).