
Figures & data

Figure 1 The effect of SCU on the proliferation ability of HepG2 cells.
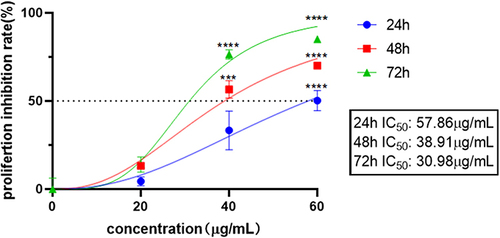
Figure 2 The effect of SCU on the apoptosis ability of HepG2 cells.
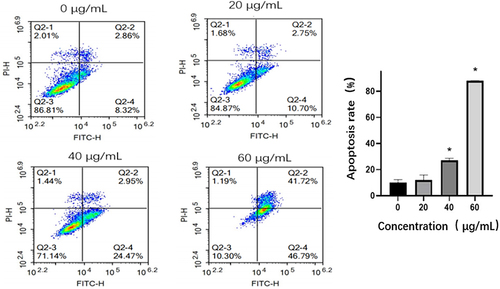
Figure 3 The effect of SCU on the growth cycle of HepG2 cells. *, **, ****Represents p < 0.05, p < 0.01, p < 0.0001, respectively.
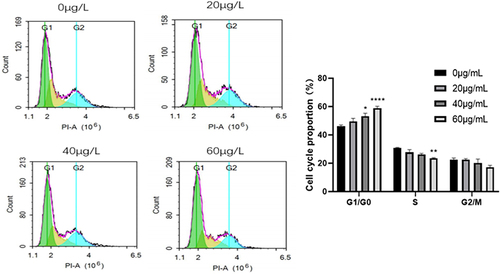
Figure 4 The effect of SCU on the migration ability of HepG2 cells.
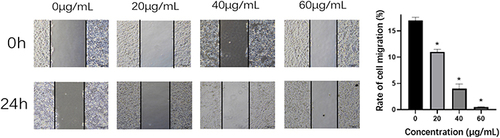
Figure 5 The effect of SCU on the invasion ability of HepG2 cells. ****Represents p < 0.0001, respectively.
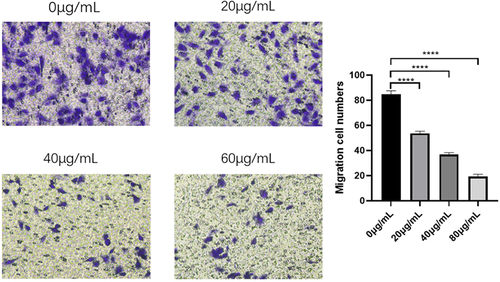
Figure 6 The effect of SCU on the proliferation ability of HepG2 cells. ****Represents p < 0.0001, respectively.
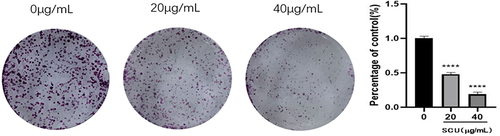
Figure 7 Cluster diagram and volcano diagram.
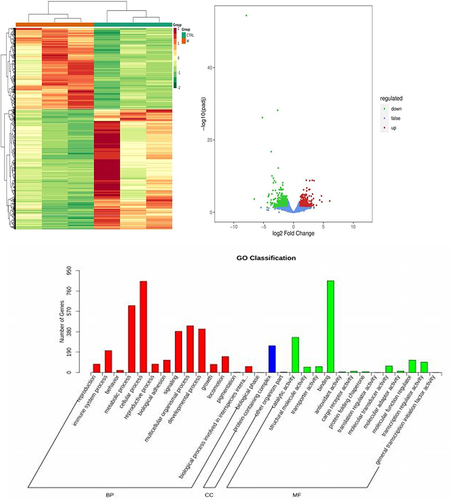
Figure 8 Gene Ontology functional classification of differentially expressed genes in HepG2 cells treated with wild Baicalin.
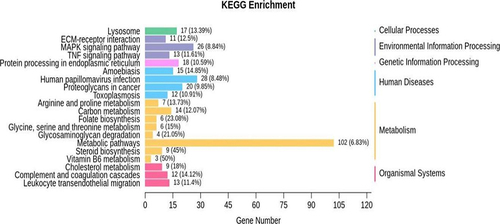
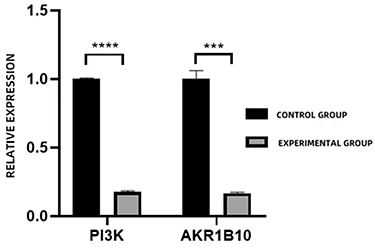
Figure 9 SCU regulates the expression of PI3K and AKR1B10 proteins in HepG2 cells. ***, ****Represents p < 0.001, p < 0.0001, respectively.
Data Sharing Statement
Data will be available on request.