Figures & data
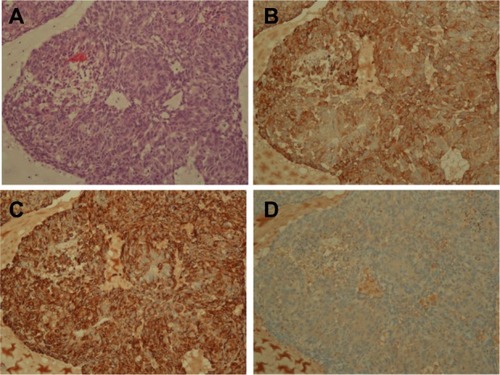
Figure 1 Tumorigenicity in mice after subcutaneous inoculation of EBC1 cells.
Notes: Tumorigenicity after inoculation of 105 (A) and 104 (B) EBC1 cells. (C) Tumorigenicity in NSG mice after inoculation of 10–103 EBC1 cells. X-axis shows period after inoculation of cells (weeks). Y-axis shows mice with tumor formation (%). (D) Tumor sizes in NSG mice after inoculation of 103 EBC1 cells. Each symbol represents an individual mouse. (E) At 12 weeks after inoculation of 103 EBC1 cells, mice were euthanized. NOD-scid and NSG mice are shown.
Abbreviations: NSG, NOD/LtSz-scid Il2rg−/−; NOD, non-obese diabetic.
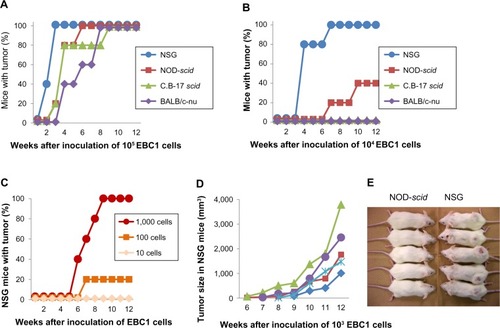
Figure 2 Tumorigenicity in mice after subcutaneous inoculation of A549 cells.
Notes: Tumorigenicity after inoculation of 105 (A) and 104 (B) A549 cells. (C) Tumorigenicity in NSG mice after inoculation of 10–103 A549 cells.
Abbreviation: NSG, NOD/LtSz-scid Il2rg−/−.
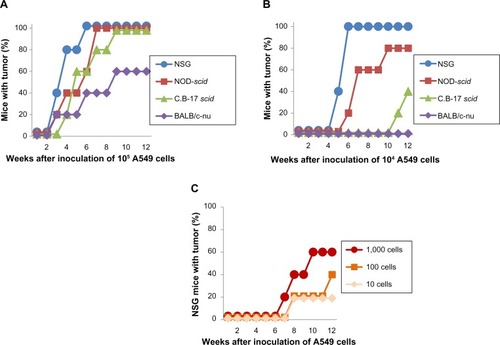
Figure 3 Pathology of developed tumor after inoculation of 10 A549 cells.
Notes: (A) Hematoxylin and eosin staining. (B) Immunostaining for anti-human pancytokeratin. (C) Immunostaining for anti-human vimentin. (D) Negative control without primary antibodies.