Figures & data
Figure 1 Study flowchart.
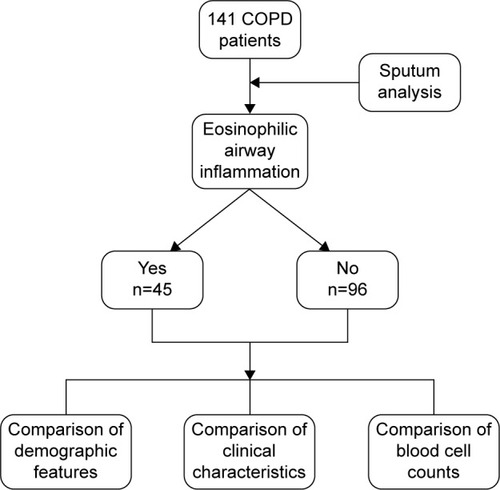
Table 1 Demographics and clinical characteristics of the study population
Table 2 Blood cell count parameters and blood cell ratios
Figure 2 Scatter dot plot comparing.
Abbreviations: ENR, eosinophil/neutrophil ratio; ELR, eosinophil/lymphocyte ratio; NLR, neutrophil/lymphocyte ratio.
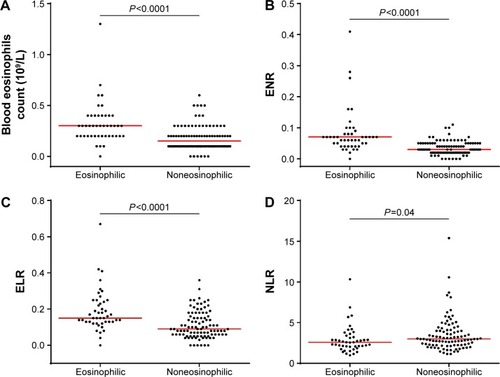
Figure 3 Scatter plots for correlations between sputum and blood eosinophil counts.
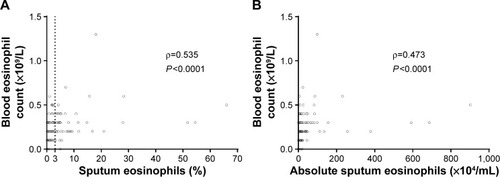
Table 3 Summary of sensitivity and specificity for different blood eosinophil cutoff points for detecting sputum eosinophilia
Figure 4 Receiver operating characteristic (ROC) curve for absolute blood eosinophil count to predict sputum eosinophilia (≥3%).
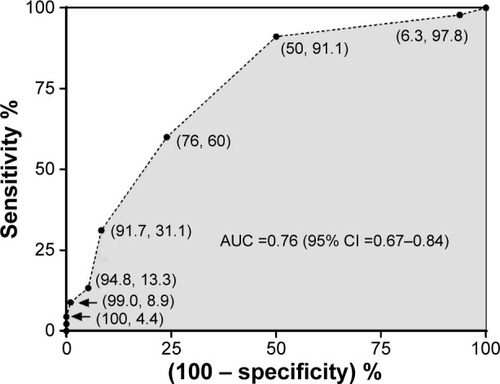
Table 4 Demographics and clinical characteristics of participants with and without blood eosinophilia
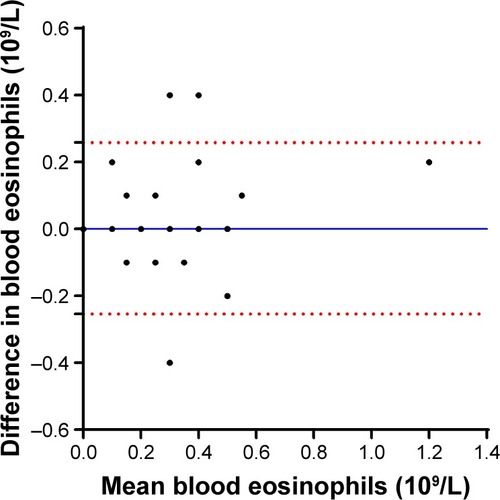
Figure 5 Bland–Altman plot showing the difference between the absolute blood eosinophil counts of two measurements against the mean of the absolute blood eosinophil counts of the two measurements.
Abbreviation: SD, standard deviation.