
Figures & data
Figure 1 Study design.
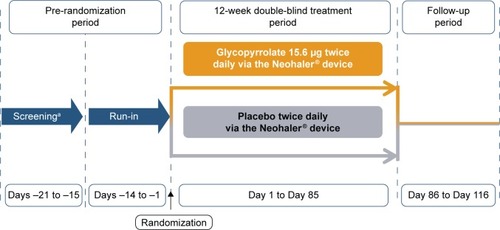
Table 1 Baseline demographics and disease characteristics (randomized set)
Figure 2 Improvement in FEV1 AUC0–12 h on day 1 and at week 12 (FAS).
Abbreviations: CI, confidence interval; FAS, full analysis set; LSM, least squares mean; FEV1, forced expiratory volume in 1 second; AUC, area under the curve; SE, standard error.
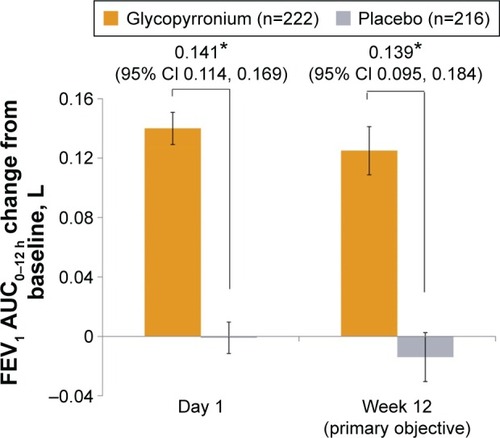
Figure 3 Forest plot of the treatment differences between glycopyrrolate and placebo in FEV1 AUC0–12 h by subgroups at week 12.
Abbreviations: CI, confidence interval; LSM, least squares mean; ICS, inhaled corticosteroids; FEV1, forced expiratory volume in 1 second; AUC, area under the curve; GOLD, Global Initiative for Chronic Obstruc tive Lung Disease.
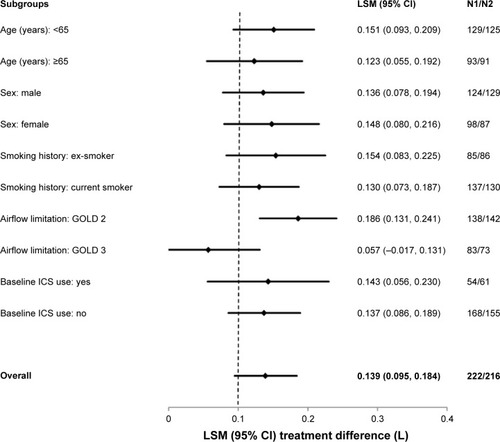
Figure 4 Improvement in trough FEV1 (FAS).
Abbreviations: FEV1, forced expiratory volume in 1 second; FAS, full analysis set; LSM, least squares mean; SE, standard error.
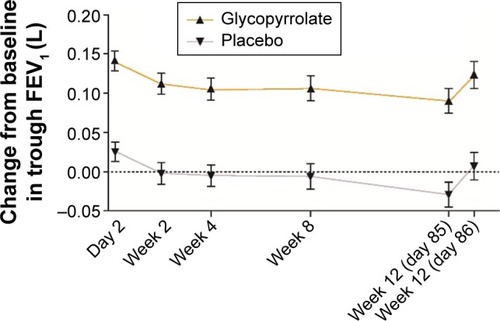
Figure 5 Serial measurements of FEV1 by timepoint on (A) day 1 and (B) week 12 (FAS).
Abbreviations: FEV1, forced expiratory volume in 1 second; FAS, full analysis set; LSM, least squares mean; SE, standard error.
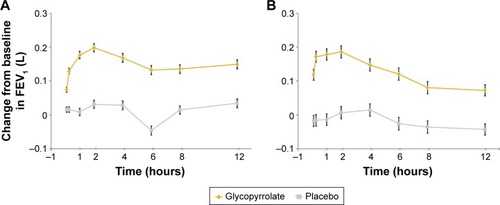
Figure 6 SGRQ total score at week 12 in FAS (A) change from baseline in each treatment group and (B) percentages of patients achieving the MCID (≥4 units reduction) in SGRQ total score.
Abbreviations: FAS, full analysis set; LSM, least squares mean; MCID, minimal clinically important difference; OR, odds ratio; SE, standard error; SGRQ, St George’s Respiratory Questionnaire.
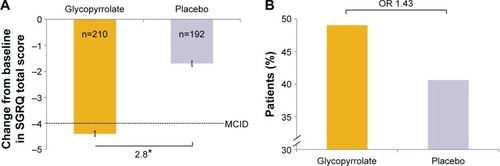
Figure 7 Improvement in TDI focal score in FAS (A) TDI focal score after 12 weeks and (B) percentages of patients achieving the MCID (≥1 unit).
Abbreviations: FAS, full analysis set; LSM, least squares mean; MCID, minimal clinically important difference; OR, odds ratio; SE, standard error; TDI, transition dyspnea index.
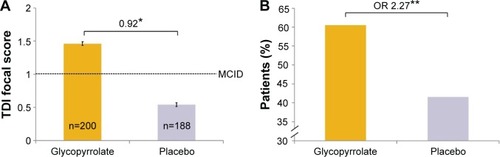
Table 2 AEs and SAEs (≥1% of patients in either treatment group), and death (safety set)
Table 3 Adjudicated serious CCV AEs during the study (safety set)