
Figures & data
Figure 1 Patient flow: selection of cases and matched controls from a source population of patients contributing data to CPRD with a diagnosis of COPD.
Abbreviations: COPD, chronic obstructive pulmonary disease; CPRD, Clinical Practice Research Datalink; GP, general practitioner; VTE, venous thromboembolism.
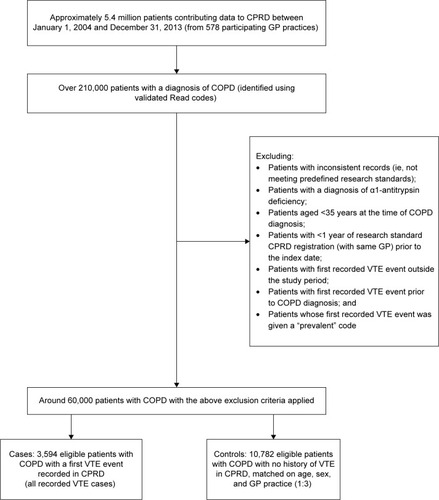
Table 1 Characteristics of cases and matched controls, and ORs for first VTE (univariate analyses adjusted for age, sex, and GP practice by matching)
Table 2 Characteristics of frequent and infrequent exacerbators, separately by cases and controls
Table 3 Percentage of frequent exacerbators with mild, moderate, severe, and very severe disease (based on the control group only)
Table 4 Summary of main results