
Figures & data
Figure 1 Quantification of baseline CT and perfusion scintigrams prior to ELVR with valves.
Abbreviations: CT, computed tomograms; ELVR, endoscopic lung volume reduction; FEV1, forced expiratory volume in 1 second; 6MWT, 6-minute walk test; HI, heterogeneity index; TL, target lobe; INL, ipsilateral nontarget lobe.
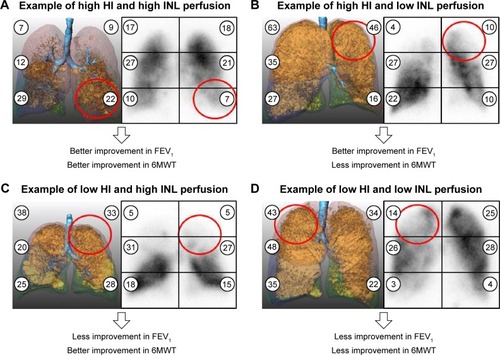
Table 1 Patient baseline characteristics and clinical outcome with respect to baseline INL perfusion
Table 2 Patient baseline characteristics and clinical outcome with respect to baseline HI
Figure 2 Clinical outcomes of patients after ELVR with valves.
Abbreviations: ELVR, endoscopic lung volume reduction; TLV, target lobe volume; FEV1, forced expiratory volume in 1 second; RV, residual volume; VC, vital capacity; SGRQ, St George’s Respiratory Questionnaire; 6MWT, 6-minute walk test.
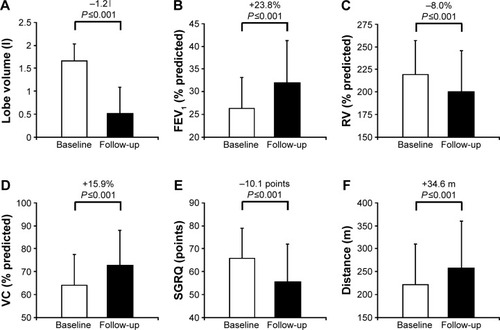
Figure 3 Correlation between lung perfusion and HI.
Abbreviations: HI, heterogeneity index; TL, target lobe; INL, ipsilateral nontarget lobe; r, Pearson’s correlation coefficient; ns, not significant.
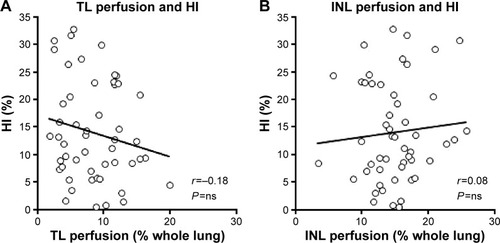
Figure 4 Correlations between perfusion of the INL, HI and outcome parameters.
Notes: P-values were calculated using the Student’s t-test. (A) Correlation between INL perfusion and change in Δ6MWT after ELVR. (B) Correlation between HI and ΔFEV1 after ELVR.
Abbreviations: INL, ipsilateral nontarget lobe; HI, heterogeneity index; 6MWT, 6-minute walk test; ELVR, endoscopic lung volume reduction; FEV1, forced expiratory volume in 1 second; r, Pearson’s correlation coefficient; Δ, change from baseline to follow-up.
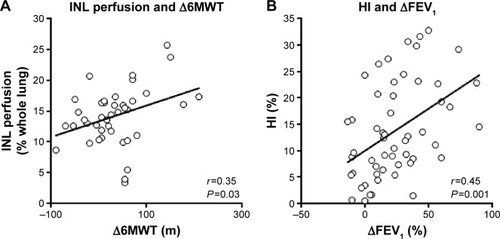
Figure 5 Clinical outcome according to baseline percentage perfusion of the INL and the HI.
Abbreviations: INL, ipsilateral nontarget lobe; HI, heterogeneity index; 6MWT, six-minute walk test; FEV1, forced expiratory volume in 1 second; perf, perfusion; TL, target lobe; INL, ipsilateral nontarget lobe; Δ, change from baseline to follow-up.
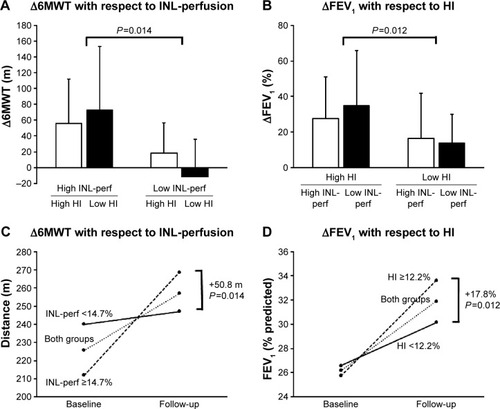
Figure S1 Correlations with baseline percentage perfusion of the TL.
Notes: P-values were calculated using the Student’s t-test. (A) Correlation between TL perfusion and ΔTLV. (B) Correlation between TL perfusion and ΔFEV1. (C) Correlation between TL perfusion and ΔRV. (D) Correlation between TL perfusion and ΔVC. (E) Correlation between TL perfusion and ΔSGRQ. (F) Correlation between TL perfusion and Δ6MWT.
Abbreviations: TL, target lobe; Δ, change from baseline to follow-up; TLV, target lobe volume; r, Pearson’s correlation coefficient; ns, not significant; FEV1, forced expiratory volume in 1 second; RV, residual volume; SGRQ, St George’s Respiratory Questionnaire; 6MWT, 6-minute walk test distance; VC, vital capacity.
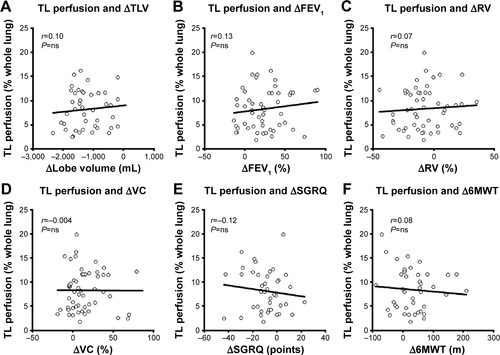
Figure S2 Correlations with baseline percentage perfusion of the INL.
Notes: P-values were calculated using the Student’s t-test. (A) Correlation between INL perfusion and ΔTLV. (B) Correlation between INL perfusion and ΔFEV1. (C) Correlation between INL perfusion and ΔRV. (D) Correlation between INL perfusion and ΔVC. (E) Correlation between INL perfusion and ΔSGRQ. (F) Correlation between INL perfusion and Δ6MWT.
Abbreviations: INL, ipsilateral nontarget lobe; Δ, change from baseline to follow-up; TLV, target lobe volume; r, Pearson’s correlation coefficient; ns, not significant; FEV1, forced expiratory volume in 1 second; RV, residual volume; SGRQ, St George’s Respiratory Questionnaire; 6MWT, 6-minute walk test distance; VC, vital capacity.
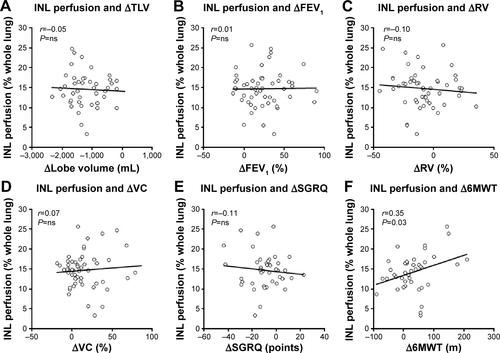
Figure S3 Correlations with baseline HI.
Notes: HI is the difference in emphysema scores between the potential TL and the ipsilateral lobe. P-values were calculated using the Student’s t-test. (A) Correlation between HI and ΔTLV. (B) Correlation between HI and ΔFEV1. (C) Correlation between HI and ΔRV. (D) Correlation between HI and ΔVC. (E) Correlation between HI and ΔSGRQ. (F) Correlation between HI and Δ6MWT.
Abbreviations: HI, heterogeneity index; TL, target lobe; Δ, change from baseline to follow-up; TLV, target lobe volume; r, Pearson’s correlation coefficient; ns, not significant; FEV1, forced expiratory volume in 1 second; RV, residual volume; SGRQ, St George’s Respiratory Questionnaire; 6MWT, 6-minute walk test distance; VC, vital capacity.
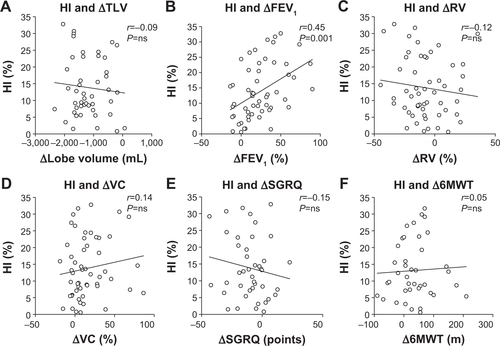
Figure S4 Correlations between baseline perfusion and ES for each lung lobe.
Notes: P-values were calculated using the Student’s t-test. (A) Correlation between baseline perfusion and ES for the RUL. (B) Correlation between baseline perfusion and ES for the LUL. (C) Correlation between baseline perfusion and ES for the RLL. (D) Correlation between baseline perfusion and ES for the LLL.
Abbreviations: ES, emphysema score; RUL, right upper lobe; LUL, left upper lobe; RLL, right lower lobe; LLL, left lower lobe; r, Pearson’s correlation coefficient.
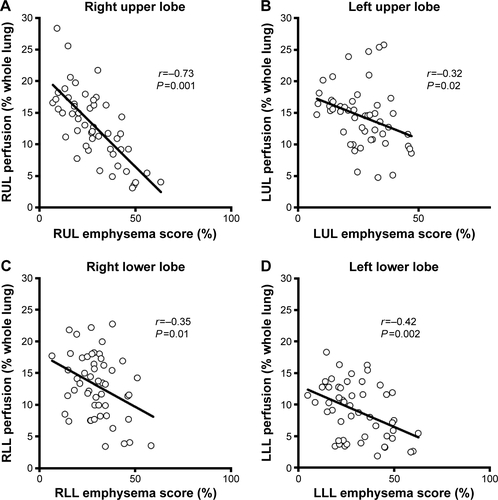
Table S1 Patient baseline characteristics and clinical outcome with respect to baseline TL perfusion
Table S2 Clinical outcome after ELVR
Table S3 Patient groups with respect to perfusion and emphysema heterogeneity