
Figures & data
Figure 1 Inclusion criteria for the study population.
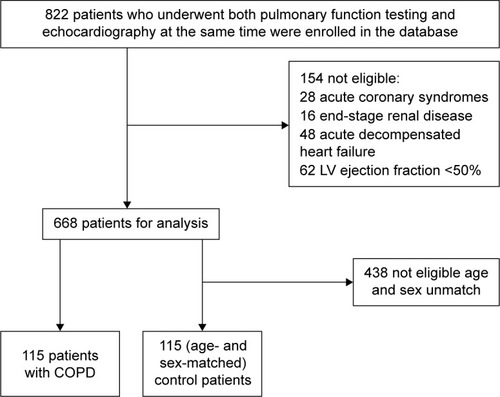
Table 1 Clinical characteristics of the study population
Table 2 Echocardiography and pulmonary function test parameters of the study population
Table 3 The relationship between PFT parameters and mean E/e′
Figure 2 Proportion of high E/e′ in each group.
Notes: Proportion of high E/e′ was significantly higher in the severe COPD group (Global Initiative for Chronic Obstructive Lung Disease III or IV) than in the control group (17.5% vs 4.3%, P=0.041). However, no difference was found in the proportion of high E/e′ between the severe COPD group and the mild-to-moderate COPD group (Global Initiative for Chronic Obstructive Lung Disease I or II; 17.5% vs 8.0%, P=0.320). P-value obtained using unpaired t-test.
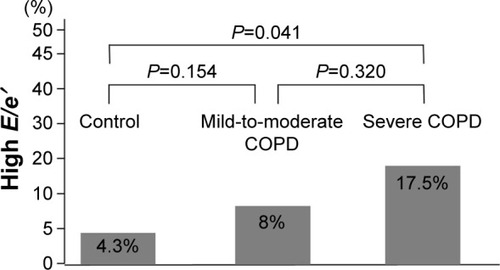
Figure 3 Correlation between mean E/e′ and FEV1 or RV/TLC ratio in all patients (n=230).
Abbreviations: FEV1, forced expiratory volume in 1 second; RV, residual volume; TLC, total lung capacity.
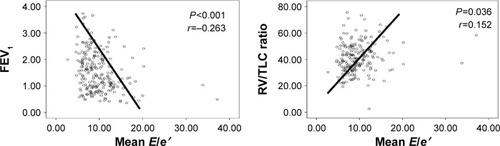
Table 4 The odds ratio of prediction for high E/e′