
Figures & data
Table 1 Comparison of studied parameters between the three groups
Figure 1 Comparison of timed up and go test between study subcohorts.
Abbreviation: COPD, chronic obstructive pulmonary disease.
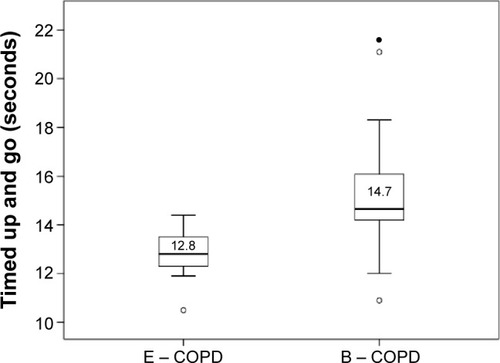
Table 2 Balance parameters in the three subgroups
Table 3 Correlations between FFM and balance parameters
Figure 2 The interrelationship between the percentage of fat-free mass and ABC (%).
Abbreviation: ABC, activities balance confidence.
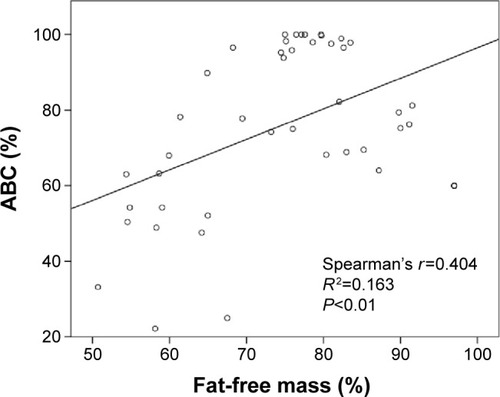
Table 4 Correlations among respiratory, inflammatory, and balance parameters