
Figures & data
Figure 1 Approach to assess the effect of anxiety and depression (exposures) at t and physical activity (outcome) at t+1 adjusting for covariates and physical activity at t.
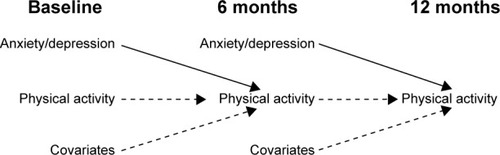
Table 1 Baseline sociodemographic, clinical, and functional characteristics of 220 COPD patients from five European sites
Figure 2 Distribution of steps and time in locomotion at t+1, according to categories of HADS-A and HADS-D at t.
Notes: (A) Steps at t+1 across HADS-A categories at t; (B) steps at t+1 across HADS-D categories at t; (C) time in locomotion t+1 months across HADS-A at t; and (D) time in locomotion at t+1 across HADS-D categories at t. HADS-A score: 0–7 normal, 8–10 suggested anxiety, and ≥11 probable anxiety. HADS normal, 8–10 suggested depression, and ≥11 probable depression.
Abbreviations: HADS-A, Hospital Anxiety and Depression Scale-anxiety; HADS-D, Hospital Anxiety and Depression Scale-Depression.
Abbreviations: HADS-A, Hospital Anxiety and Depression Scale-anxiety; HADS-D, Hospital Anxiety and Depression Scale-Depression.
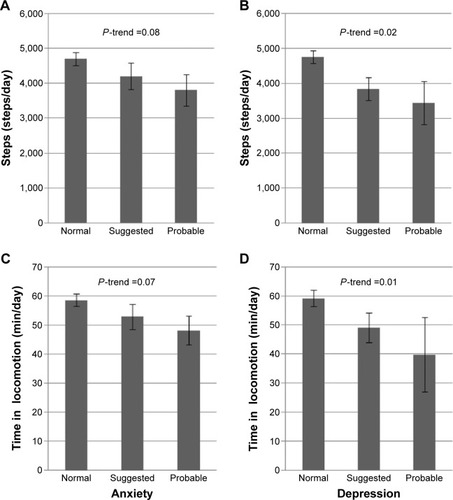
Table 2 Crude and adjusted associations between HADS-depression score at t and daily steps at t+1 (linear regression model)