
Figures & data
Figure 1 Patient disposition.
Note: *Lack of efficacy includes patients who withdrew due to COPD exacerbation.
Abbreviations: ASE, all subjects enrolled; TIO, tiotropium; UMEC, umeclidinium.
Abbreviations: ASE, all subjects enrolled; TIO, tiotropium; UMEC, umeclidinium.
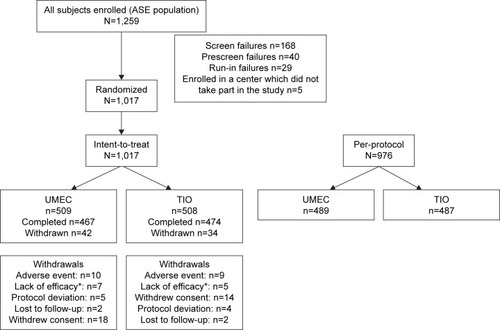
Table 1 Baseline demographics and clinical characteristics (ITT population)
Table 2 Summary of lung function end points (ITT and TFH populations)
Figure 2 LS mean change from baseline in trough FEV1 (mL) (PP population).
Notes: n1, number of patients with analyzable data for ≥1 time points. n2, number of subjects with analyzable data at the current time point.
Abbreviations: CI, confidence interval; FEV1, forced expiratory volume in 1 second; LS, least squares; PP, per-protocol; SE, standard error; TIO, tiotropium; UMEC, umeclidinium.
Abbreviations: CI, confidence interval; FEV1, forced expiratory volume in 1 second; LS, least squares; PP, per-protocol; SE, standard error; TIO, tiotropium; UMEC, umeclidinium.
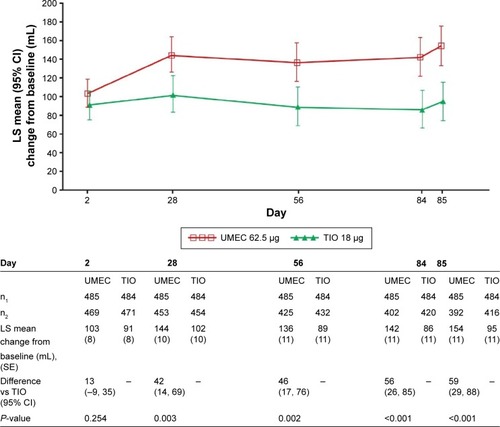
Figure 3 LS mean change from baseline in serial FEV1 (mL) on day 1 (A) and on day 84 (B) (both days: TFH population).
Abbreviations: CI, confidence interval; FEV1, forced expiratory volume in 1 second; LS, least squares; TFH, 24-hour; TIO, tiotropium; UMEC, umeclidinium.
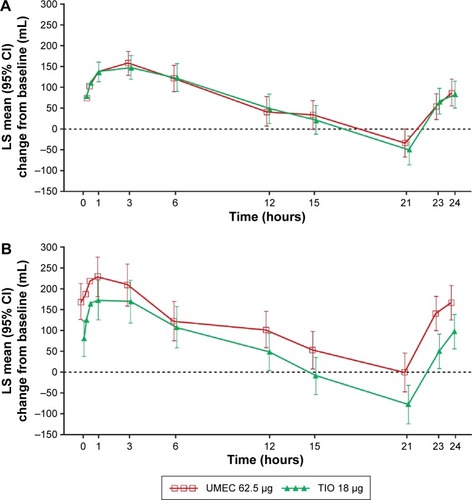
Table 3 Summary of symptomatic and health-related quality of life end points (ITT population)
Table 4 Inhaler assessments
Figure 4 Proportion of trough FEV1 responders.
Notes: *P<0.05. Response was defined as an increase of ≥100 mL above baseline FEV1.
Abbreviations: CI, confidence interval; OR, odds ratio; FEV1, forced expiratory volume in 1 second; TIO, tiotropium; UMEC, umeclidinium.
Abbreviations: CI, confidence interval; OR, odds ratio; FEV1, forced expiratory volume in 1 second; TIO, tiotropium; UMEC, umeclidinium.
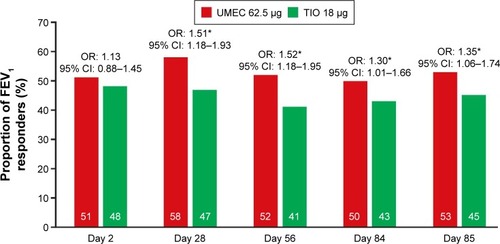
Table 5 Summary of safety results (ITT population)