Figures & data
Figure 1 Study design.
Notes:
aDischarge date after the first chronologically occurring COPD exacerbation resulting in hospitalization or an ED visit.
Abbreviations: ED, emergency department; MT, maintenance treatment.
Abbreviations: ED, emergency department; MT, maintenance treatment.
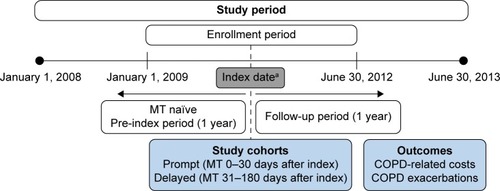
Table 1 Baseline demographics and characteristics
Figure 2 Adjusted annual costs per patient according to MT initiation cohort (prompt =0–30 days; delayed =31–180 days).
Notes: *P<0.010. Adjusted costs obtained from statistical model: semilog OLS controlling for age, sex, region, comorbidity, COPD severity (including pre-index COPD-related total costs), and type of index exacerbation. A two-part semilog OLS model was used for medical costs.
Abbreviations: CI, confidence interval; MT, maintenance treatment; OLS, ordinary least squares.
Abbreviations: CI, confidence interval; MT, maintenance treatment; OLS, ordinary least squares.
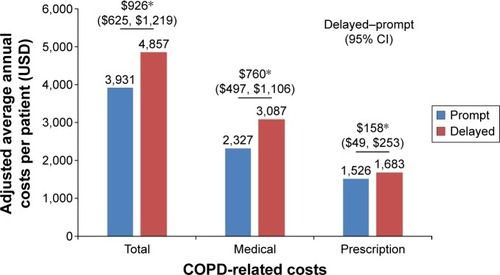
Figure 3 (A) Adjusted relative odds of subsequent COPD exacerbation and (B) adjusted relative exacerbation incident rate ratio for the delayed MT cohort (prompt =0–30 days; delayed =31–180 days).
Notes: *P<0.050; **P<0.010; ***P<0.001. Dashed lines at 1.00 indicate the reference lines. Relative odds obtained from logistic regression model estimating likelihood of an event controlling for index exacerbation type and baseline covariates. Incidence rate ratio obtained from zero-inflated negative binomial regression model estimating likelihood of an event controlling for index exacerbation type and baseline covariates.
Abbreviations: CI, confidence interval; ED, emergency department; MT, maintenance treatment; OCSs, oral corticosteroids; Phy + Rx, physician visit with a prescription for OCSs and/or antibiotics in the subsequent 5 days.
Abbreviations: CI, confidence interval; ED, emergency department; MT, maintenance treatment; OCSs, oral corticosteroids; Phy + Rx, physician visit with a prescription for OCSs and/or antibiotics in the subsequent 5 days.
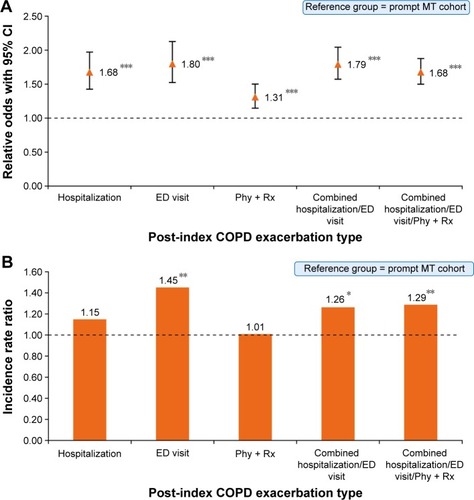
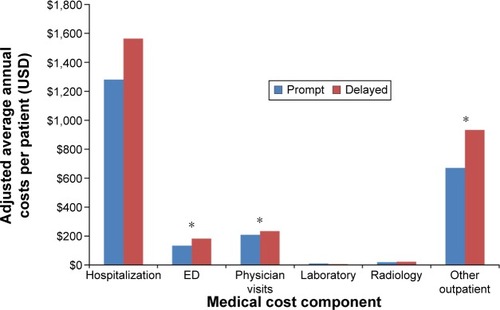
Figure 4 Adjusted annual cost per patient by medical component (prompt =0–30 days; delayed =31–180 days).
Notes: *P<0.050. Adjusted costs obtained from statistical model: a two-part generalized linear model controlling for age, sex, region, comorbidity, COPD severity (including pre-index COPD-related total costs), and type of index exacerbation.
Abbreviation: ED, emergency department.
Abbreviation: ED, emergency department.