Figures & data
Table 1 Baseline patient characteristics
Table 2 Exacerbation frequency
Figure 1 Kaplan–Meier plots showing the time to first exacerbation in (A) all patients, (B) patients with airway-dominant phenotype, and (C) patients with <2 years of disease duration.
Abbreviations: CI, confidence interval; LYS, lysozyme.
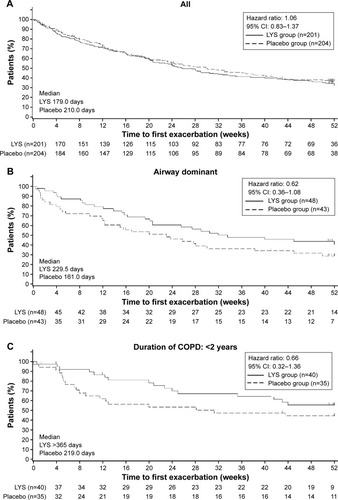
Figure 2 Changes in FEV1 from the baseline (mean ± standard error).
Abbreviations: FEV1, forced expiratory volume in 1 second; LYS, lysozyme.
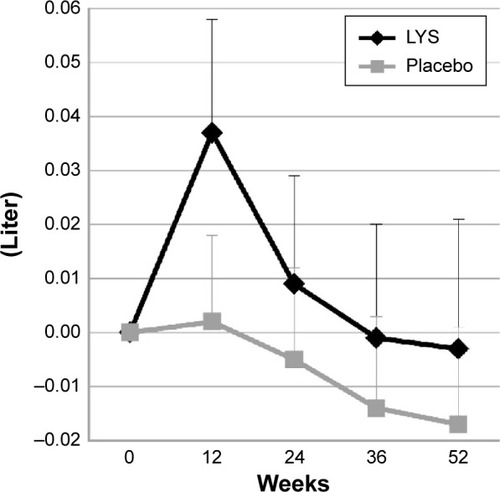
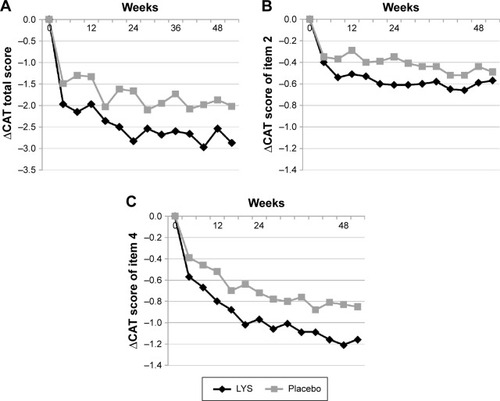
Figure 3 Mean changes in CAT scores from baseline.
Note: (A) Summary score, (B) item 2 (mucus volume), and (C) item 4 (breathlessness).
Abbreviations: CAT, COPD assessment test; LYS, lysozyme.
Abbreviations: CAT, COPD assessment test; LYS, lysozyme.