
Figures & data
Figure 1 A CONSORT diagram illustrating the selection of patients included in the data analysis.
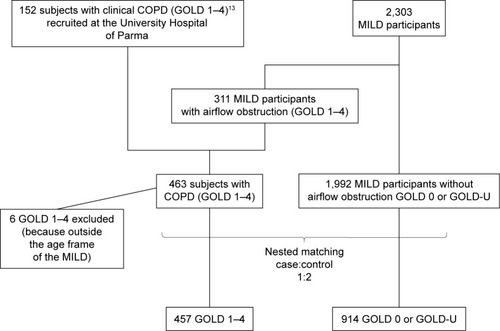
Table 1 Classification of LDCT patterns in subjects with definite and equivocal ILA
Table 2 Characteristics of cases vs controls
Table 3 LDCT patterns frequency
Table 4 Characteristics of subjects stratified for the presence of ILA
Figure 2 A 57-year-old former male smoker with clinical chronic obstructive lung disease (COPD).
Notes: (A) Both study observers jointly considered the thick-walled low attenuation areas in the lower lobes as consistent with reticular opacities superimposed to pulmonary emphysema (ie, not as honeycombing). (B) The latter was also abundant in the upper middle lung regions. The LDCT pattern was indeed rated as possible UIP.
Abbreviations: LDCT, low-dose computed tomography; UIP, usual interstitial pneumonia.
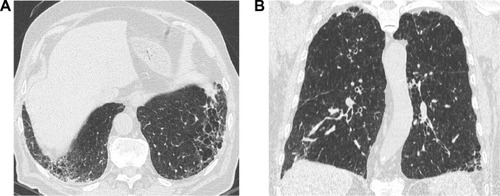
Figure 3 A 67-year-old male current smoker with no airflow obstruction on PFT (control) and a possible UIP pattern on LDCT.
Note: Subpleural basal reticular opacities containing traction bronchiectasis without evidence of honeycombing can be appreciated.
Abbreviations: PFT, pulmonary function test; UIP, usual interstitial pneumonia; LDCT, low-dose computed tomography.
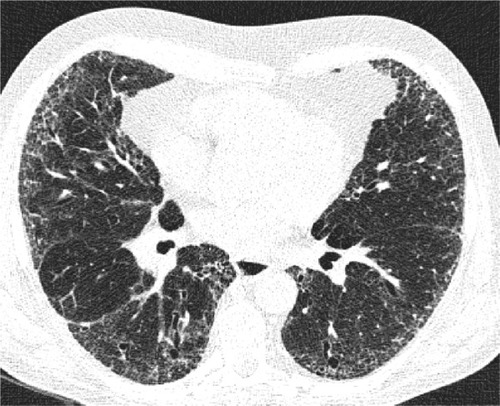
Figure 4 A 59-year-old control current female smoker with an LDCT showing patchy GGO and poorly defined centrilobular nodules consistent with signs of RB.
Abbreviations: LDCT, low-dose computed tomography; GGO, ground glass opacity; RB, respiratory bronchiolitis.
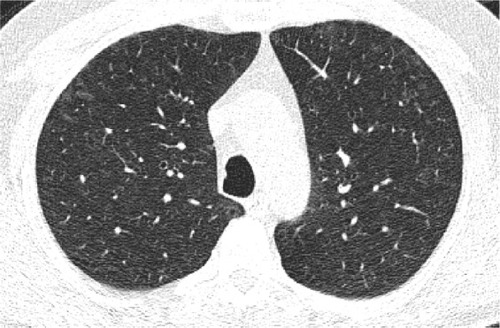
Figure 5 An axial LDCT image of a 79-year-old former male smoker with clinical COPD showing thick-walled, bizarre-shaped emphysematous areas in the right lower lobe that were regarded as consistent with AEF.
Abbreviations: LDCT, low-dose computed tomography; AEF, airspace enlargement with fibrosis.
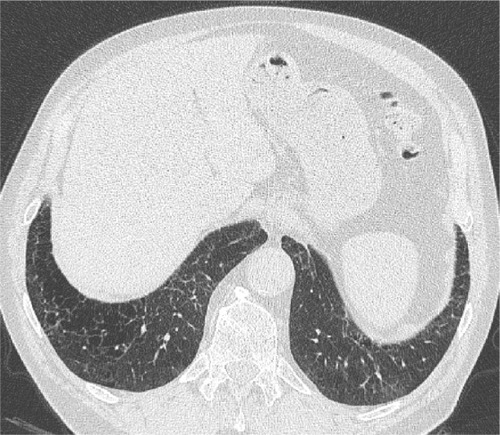
Figure 6 The plots (A and B) show FEV1 (percentage of predicted value) plotted against FEV1/FVC (percent of predicted value) for the participants with (red circle) and without any ILA (black cross) and participants with (red circle) and without any fibrotic ILA (black cross), respectively, and classify them according to the GOLD criteria.
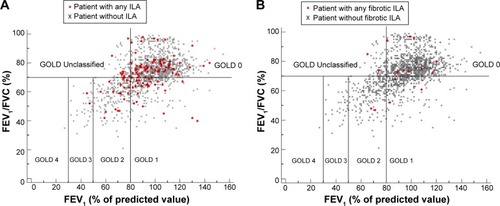
Table 5 Univariate and multivariate logistic regression models predicting the likelihood of definite ILA
Table 6 Univariate and multivariate logistic regression models predicting the likelihood of any fibrotic ILA
Table S1 Individual LDCT features
Table S2 Any ILA or fibrotic ILA distributions across GOLD stages