Figures & data
Table 1 The number (%) of participants with respiratory symptoms or allergies by sex and survey
Table 2 Baseline and follow-up characteristics of subjects who had spirometry in 1993 and 2013
Table 3 Multiple regression coefficients (with 95% CI) for associations between decline in FEV1 and clinical characteristics
Figure 1 Mean (with 95% CI) decline in FEV1 mL/year by smoking at baseline.
Abbreviation: CI, confidence interval.
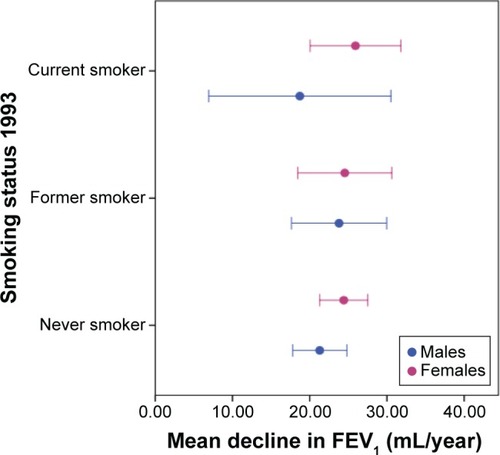
Table 4 Multiple regression coefficients (with 95% CI) for associations between decline in FVC and clinical characteristics
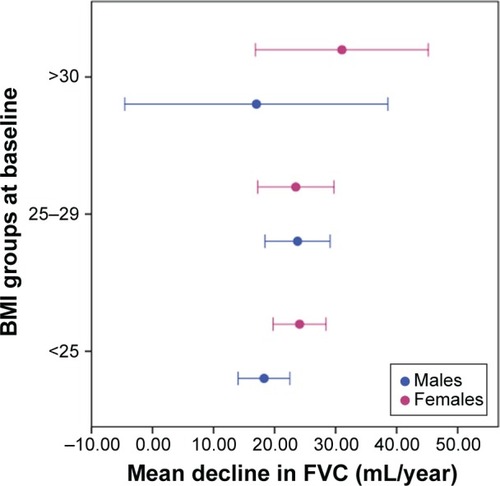
Figure 2 Mean decline in FVC (mL/year) over time categorized by baseline BMI (kg/m2) in males and females.
Abbreviation: BMI, body mass index.