
Figures & data
Figure 1 CONSORT diagram showing patient flow.
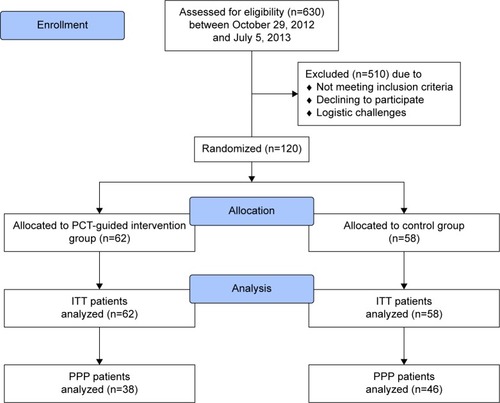
Figure 2 PCT-guided antibiotic therapy – algorithm.
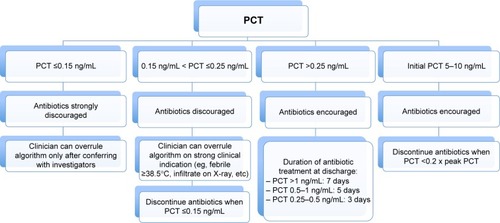
Table 1 Baseline characteristics of the study population, overall and by randomization
Table 2 Clinical characteristics and final diagnoses of the study population, overall and by randomization
Table 3 Antibiotic exposure, antibiotic prescription rate, and length of hospital stay by randomization
Figure 3 Antibiotic exposure in patients receiving antibiotic therapy, intention-to-treat.
Note: Red bars indicate primary endpoints of study.
Abbreviations: PCT, procalcitonin; d, days.
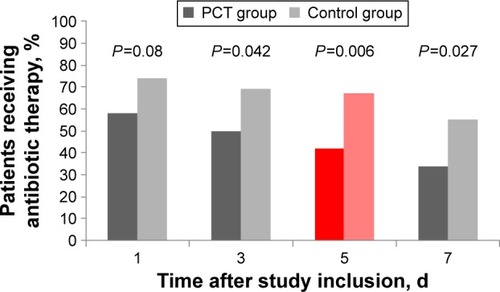
Figure 4 Antibiotic exposure in patients receiving antibiotic therapy, per-protocol population.
Abbreviations: PCT, procalcitonin; d, days.
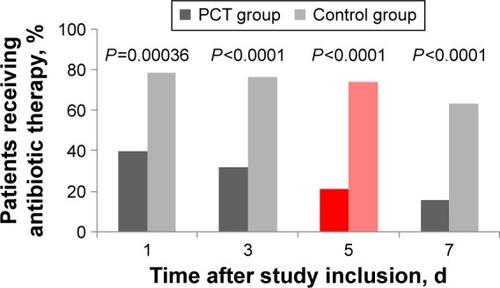
Table 4 Rates of combined adverse outcomes and mortality by randomization group