
Figures & data
Table 1 Baseline characteristics of the 169 studied patients
Figure 1 Correlation between meters at 6MWD and the BI-d scale.
Abbreviations: BI-d, Barthel Index-dyspnea; 6MWD, 6-minute walking distance.
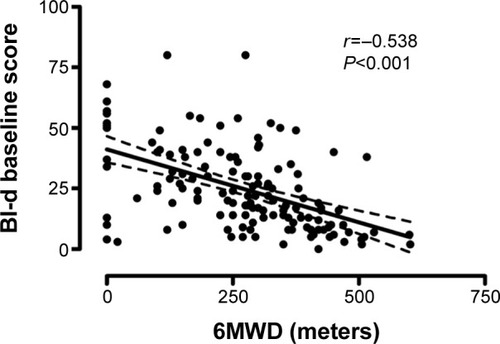
Figure 2 Box plot of distribution of BI-d according to MRC dyspnea score grading (0–4) measured at baseline.
Notes: Statistical significance (P<0.001) was found among MRC dyspnea score grading groups; statistical significance (P<0.01) was found between MRC grade 4 and all the other MRC grading groups.
Abbreviations: BI-d, Barthel Index-dyspnea scale; MRC, Medical Research Council.
Abbreviations: BI-d, Barthel Index-dyspnea scale; MRC, Medical Research Council.
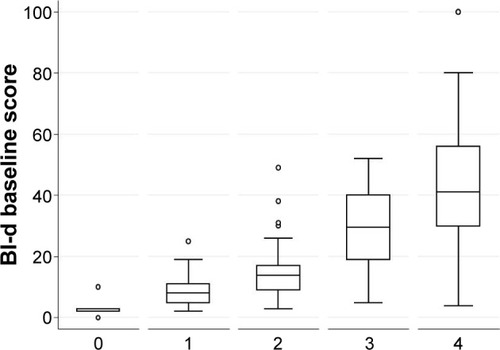
Figure 3 Mean distribution of each BI-d item at admission (dark line) and discharge (gray line).
Note:
*P<0.001 over time.
Abbreviation: BI-d, Barthel Index-dyspnea.
Abbreviation: BI-d, Barthel Index-dyspnea.
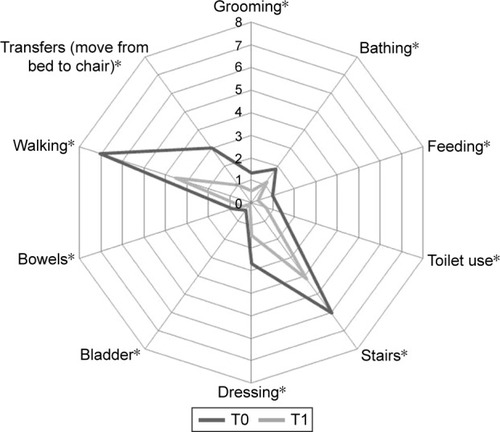
Table 2 Median assessed at the beginning (T0) and at the end (T1) of the rehabilitative program using the two indexes BI and BI assessing dyspnea perception (BI-d) in the two subgroups (no CRF vs yes CRF)
Table S1 BI-d