Figures & data
Table 1 Demographics of patients used in this study
Figure 1 Time course of cytokine release from poly(I:C)- and R848-stimulated lung tissue.
Notes: The release of TNFα (A and D), CCL5 (B and E), and IL-6 (C and F) from poly(I:C)- (100 μg/mL) (A–C) and R848-stimulated (10 μg/mL) (D–F) whole tissue explants from smokers and COPD patients (pooled, n=13) were measured after 1, 6, 24, and 48 hours. Data presented as mean with SEM (TNFα and IL-6) or median with range (CCL5). *, **, ***Refer to significantly above time-matched unstimulated control (P<0.05, 0.01, 0.001, respectively). Results were obtained using paired t-tests (TNFα and IL-6) and Wilcoxon matched-pairs test (CCL5).
Abbreviations: TNFα, tumor necrosis factor α; IL-6, interleukin 6; COPD, chronic obstructive pulmonary disease; SEM, standard error of the mean; h, hour(s).
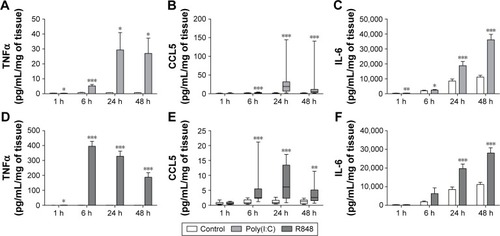
Figure 2 Time course of cytokine mRNA expression in poly(I:C)- and R848-stimulated lung tissue.
Abbreviations: TNFα, tumor necrosis factor α; IL-6, interleukin 6; COPD, chronic obstructive pulmonary disease; h, hour(s).
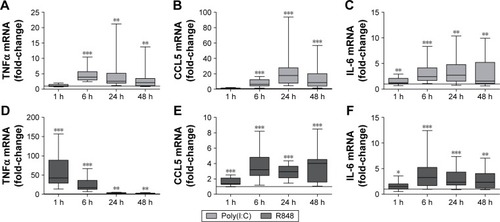
Figure 3 Concentration-dependent induction of cytokine release from poly(I:C)- and R848-stimulated lung tissue.
Abbreviations: TNFα, tumor necrosis factor α; IgG, immunoglobulin G; IL-6, interleukin 6; COPD, chronic obstructive pulmonary disease; SEM, standard error of the mean.
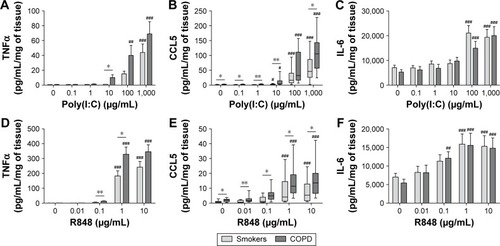
Figure 4 Effect of simultaneous activation of TLR3 and TLR7/8 on pro-inflammatory cytokine release from lung tissue.
Abbreviations: TNFα, tumor necrosis factor α; IL-6, interleukin 6; COPD, chronic obstructive pulmonary disease; SEM, standard error of the mean; Comb, combination.
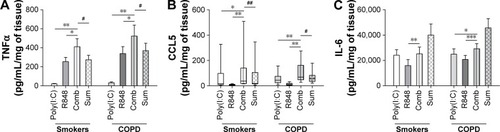
Figure 5 Effect of TNFα neutralization on pro-inflammatory cytokine release from lung tissue.
Abbreviations: TNFα, tumor necrosis factor α; IgG, immunoglobulin G; IL-6, interleukin 6; COPD, chronic obstructive pulmonary disease; SEM, standard error of the mean; ANOVA, analysis of variance.
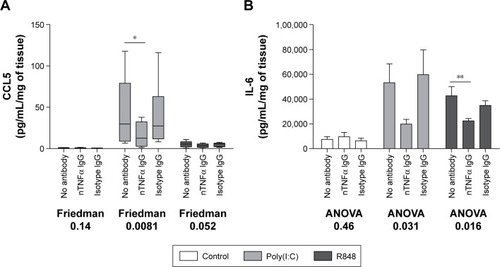
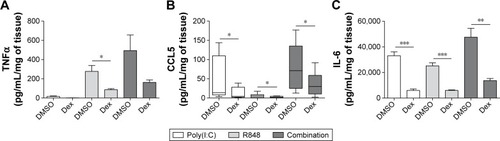
Figure 6 Effect of dexamethasone on pro-inflammatory cytokine release from TLR-stimulated lung tissue.
Abbreviations: TNFα, tumor necrosis factor α; IL-6, interleukin 6; COPD, chronic obstructive pulmonary disease; SEM, standard error of the mean; Dex, dexamethasone; DMSO, dimethyl sulfoxide.