
Figures & data
Table 1 Latent class fit indices for two- through four-class solutions using symptom occurrence rates for 14 symptoms from the Memorial Symptom Assessment Scale
Figure 1 The probability of occurrence for the 14 symptoms in the three latent classes.
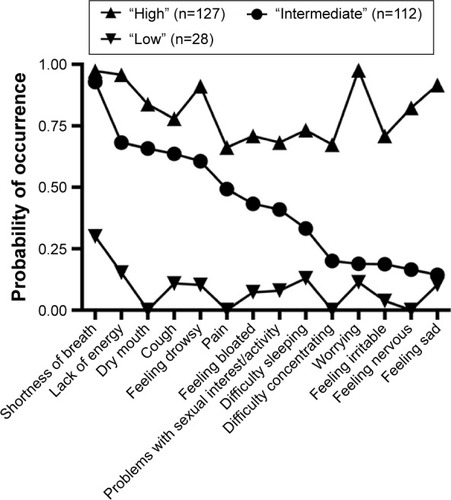
Table 2 Differences in demographic and clinical characteristics among the three latent classes
Table 3 Differences among the three latent classes in MSAS and SGRQs
Table 4 Rank order of the probability of occurrence of the 14 MSAS symptoms for each of the three latent classes