Figures & data
Table 1 Characteristics of study population
Figure 1 Frequency of exacerbation with different severities over 2 years.
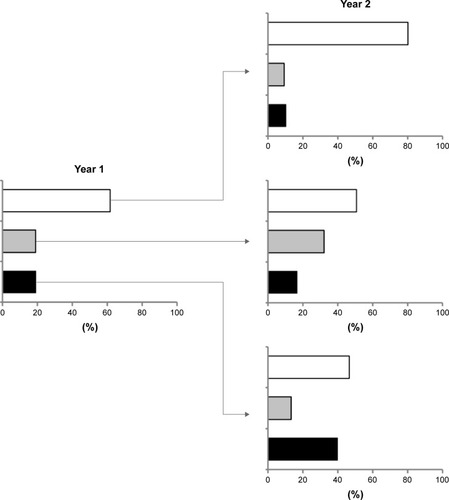
Table 2 Comparison of baseline characteristics among patients stratified according to severity of exacerbation
Table 3 Comparison of baseline comorbidities among patients stratified according to severity of exacerbation
Figure 2 Annual changes in FEV1 in three groups of patients over 2 years of follow-up.
Abbreviation: FEV1, forced expiratory volume in 1 second.
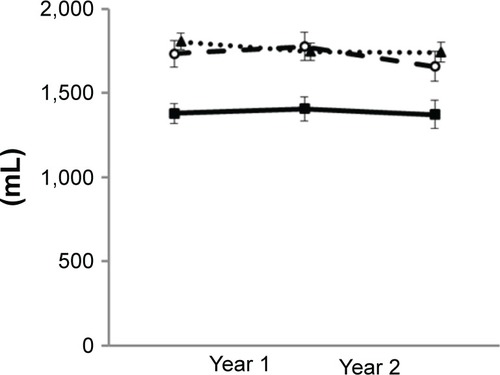
Figure 3 Annual changes in LAA% in three groups of patients over 2 years of follow-up.
Abbreviation: LAA%, ratio of low attenuation area.
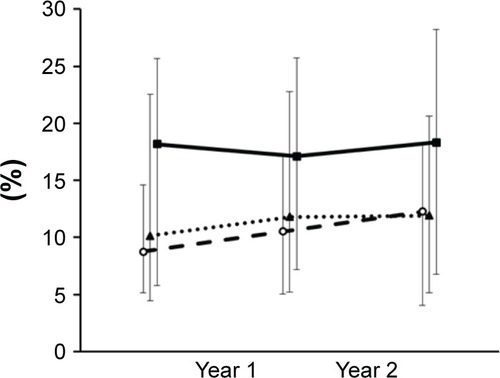
Table 4 Predictors of CAT (minimal clinical important difference; ΔCAT ≥2 per year) increase determined by multivariate logistic regression analysis
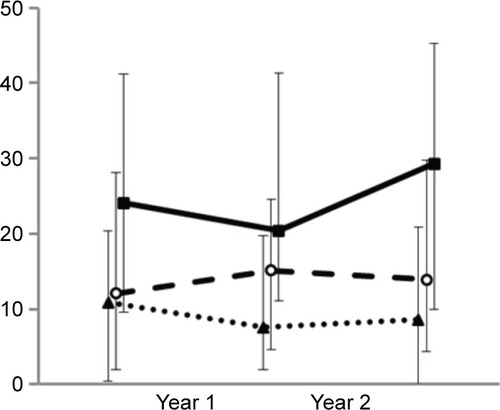
Figure 4 Annual changes in CAT scores in three groups of patients over 2 years of follow-up.
Abbreviation: CAT, COPD assessment test.
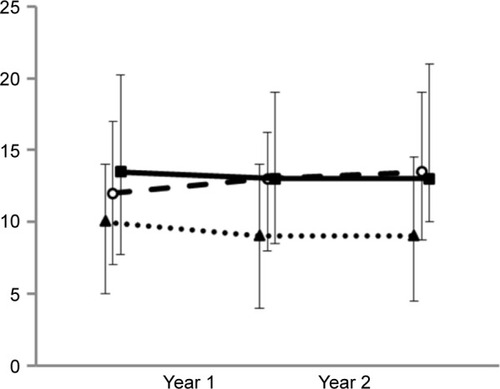
Figure 5 Annual changes in SGRQ total scores over 2 years of follow-up.
Notes: Patients in the exacerbation-free (••▲••), mild exacerbator (–○–), and moderate/severe exacerbator (–■–) groups. Moderate/severe exacerbator vs exacerbation free, P<0.001; mild exacerbator vs exacerbation free, P=0.041; and mild exacerbator vs moderate/severe exacerbator, P=0.013.
Abbreviation: SGRQ, St George’s Respiratory Questionnaire.
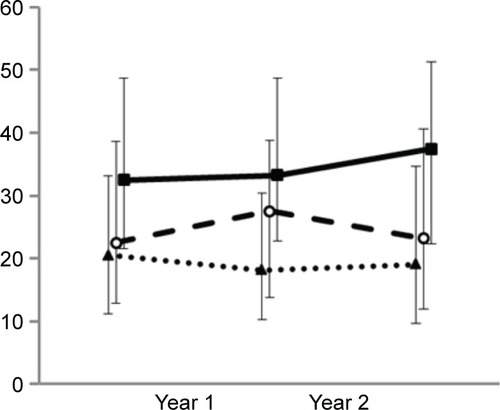
Figure 6 Annual changes in SGRQ symptoms category over 2 years of follow-up.
Notes: Patients in the exacerbation-free (••▲••), mild exacerbator (–○–), and moderate/severe exacerbator (–■–) groups. Moderate/severe exacerbator vs exacerbation free, P<0.001; mild exacerbator vs exacerbation free, P=0.002; and mild exacerbator vs moderate/severe exacerbator, P=1.000.
Abbreviation: SGRQ, St George’s Respiratory Questionnaire.
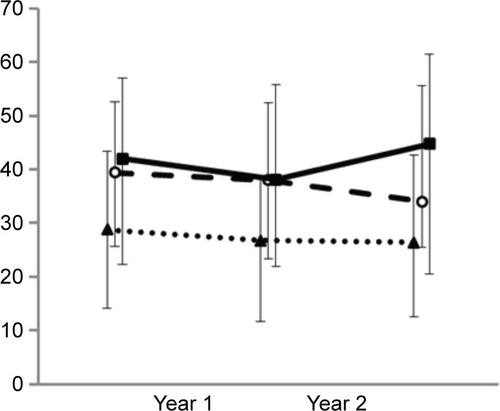
Figure 7 Annual changes in SGRQ activity category over 2 years of follow-up.
Notes: Patients in the exacerbation-free (••▲••), mild exacerbator (–○–), and moderate/severe exacerbator (–■–) groups. Moderate/severe exacerbator vs exacerbation free, P<0.001; mild exacerbator vs exacerbation free, P=0.226; and mild exacerbator vs moderate/severe exacerbator, P=0.004.
Abbreviation: SGRQ, St George’s Respiratory Questionnaire.

Figure 8 Annual changes in SGRQ impact category over 2 years of follow-up.
Abbreviation: SGRQ, St George’s Respiratory Questionnaire.