
Figures & data
Figure 1 SPRING study design.
Abbreviations: od, once-daily; SPRING, Symptoms and Pulmonary function in the moRnING.
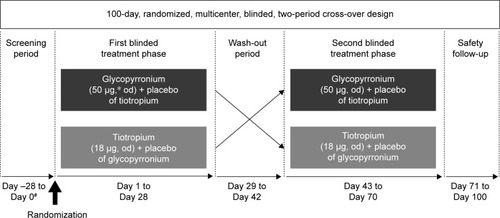
Figure 2 Disposition of patients during the study.
Abbreviation: ITT, intention-to-treat.
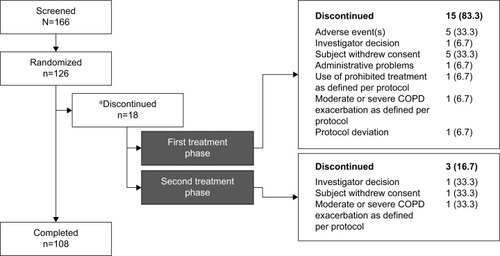
Table 1 Baseline characteristics (ITT population)
Figure 3 FEV1 AUC0-4h treatment differences between glycopyrronium and tiotropium post-first treatment dose on Day 1 (ITT and PP population).
Abbreviations: FEV1, forced expiratory volume in 1 second; AUC0-4h, area under the curve from 0 to 4 hours; CI, confidence interval; ITT, intention-to-treat; od, once-daily; PP, per protocol.
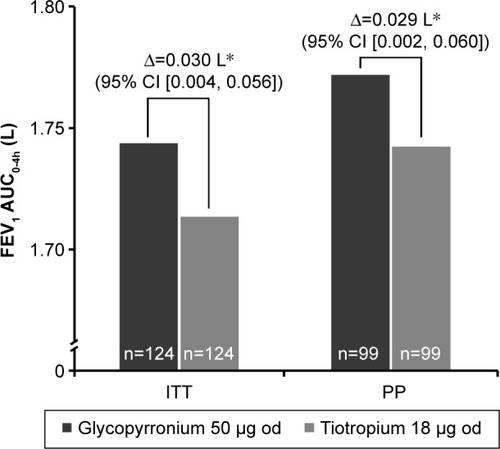
Figure 4 FEV1 AUC0-4h treatment differences between glycopyrronium and tiotropium by time point post-first treatment dose on Day 1 (ITT population).
Abbreviations: FEV1, forced expiratory volume in 1 second; AUC0-4h, area under the curve from 0 to 4 hours; ITT, intention-to-treat; od, once-daily.
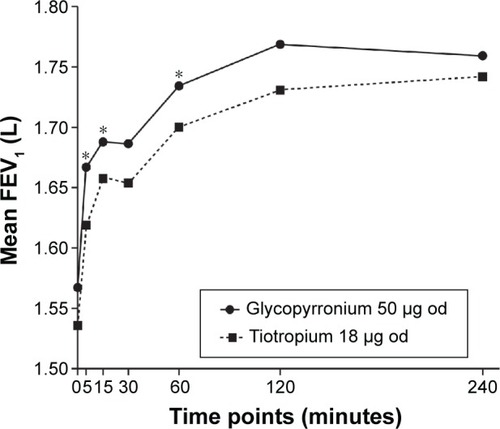
Table 2 PRO-Morning COPD Symptoms Questionnaire total score comparison between Day 1 versus Day 28 for each treatment, separately (ITT population)
Table 3 Summary of safety findings (safety population)
Figure S1 FEV1 AUC0-4h treatment differences between glycopyrronium and tiotropium post-first treatment dose on Day 28 (ITT).
Notes: P=0.7293; data are least squares means; Δ, treatment difference between glycopyrronium and tiotropium.
Abbreviations: AUC0-4h, area under the curve from 0 to 4 hours; CI, confidence interval; FEV1, forced expiratory volume in 1 second; ITT, intention-to-treat; od, once-daily.
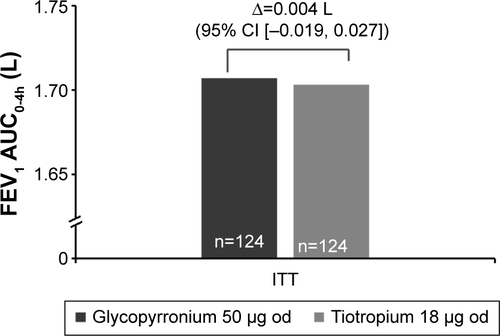
Figure S2 FEV1 AUC0-4h treatment differences between glycopyrronium and tiotropium by time point post-first treatment dose on Day 28 (ITT population).
Abbreviations: AUC0-4h, area under the curve from 0 to 4 hours; FEV1, forced expiratory volume in 1 second; ITT, intention-to-treat; od, once-daily.
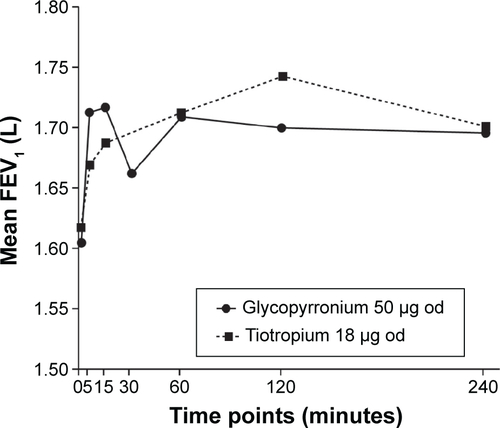
Table S1 PRO-Morning COPD Symptoms Questionnaire