Figures & data
Figure 1 IRB deranged respiratory system mechanics.
Abbreviations: ctr, control; IRB, inspiratory resistive breathing; SEM, standard error of the mean.
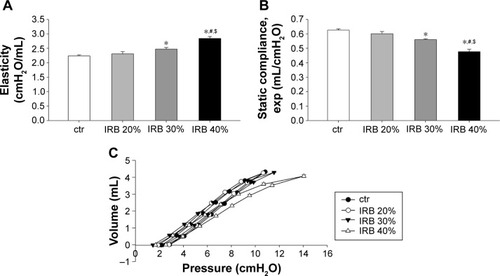
Figure 2 IRB caused lung inflammation.
Abbreviations: BALF, bronchoalveolar lavage fluid; ctr, control; IL, interleukin; IRB, inspiratory resistive breathing; MPO, myeloperoxidase; OD, optical density; SEM, standard error of the mean.
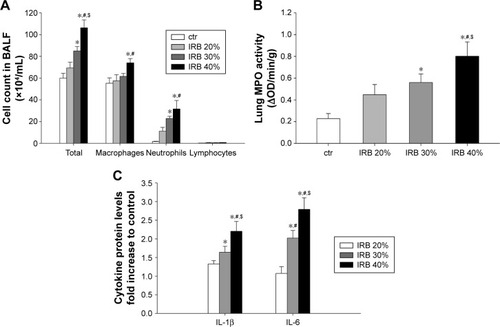
Figure 3 IRB increased lung permeability and induced lung injury.
Abbreviations: BALF, bronchoalveolar lavage fluid; ctr, control; IRB, inspiratory resistive breathing; SEM, standard error of the mean.
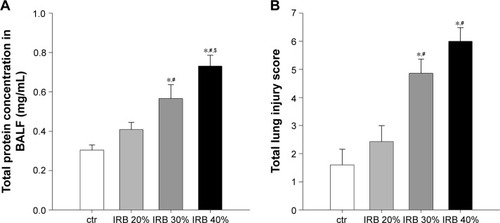
Table 1 Differential effect of resistive loading on lung histology
Figure 4 ERB did not affect lung mechanics.
Abbreviations: ctr, control; ERB, expiratory resistive breathing; SEM, standard error of the mean.
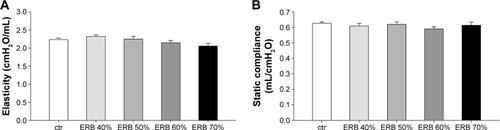
Figure 5 ERB produced neutrophilic lung inflammation.
Abbreviations: BALF, bronchoalveolar lavage fluid; ctr, control; ERB, expiratory resistive breathing; IL, interleukin; MPO, myeloperoxidase: OD, optical density; SEM, standard error of the mean.
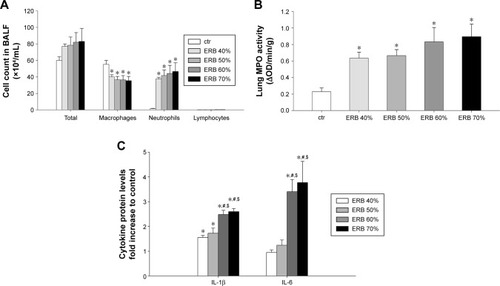
Figure 6 ERB effect on lung permeability and histology.
Abbreviations: BALF, bronchoalveolar lavage fluid; ctr, control; ERB, expiratory resistive breathing; SEM, standard error of the mean.
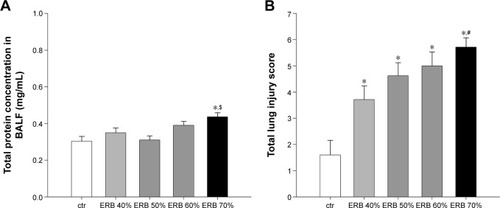
Figure 7 CRB modified lung mechanical parameters.
Abbreviations: ctr, control; CRB, combined resistive breathing; P–V, pressure–volume; SEM, standard error of the mean.
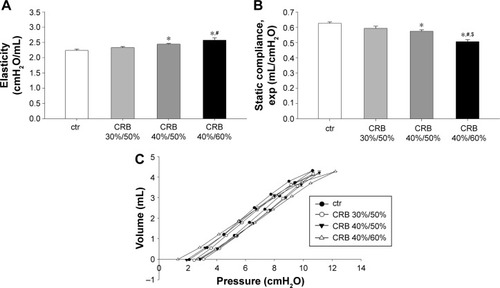
Figure 8 CRB provoked lung inflammation.
Abbreviations: BALF, bronchoalveolar lavage fluid; ctr, control; CRB, combined resistive breathing; IL, interleukin; MPO, myeloperoxidase; OD, optical density; SEM, standard error of the mean.
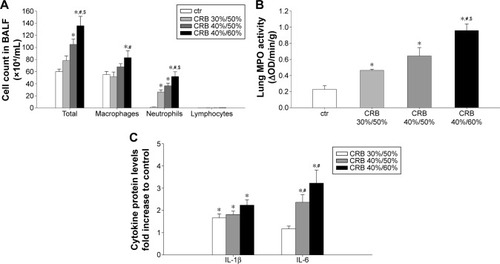
Figure 9 CRB increased lung permeability and induced lung injury.
Abbreviations: ALI, acute lung injury; BALF, bronchoalveolar lavage fluid; ctr, control; CRB, combined resistive breathing; SEM, standard error of the mean.
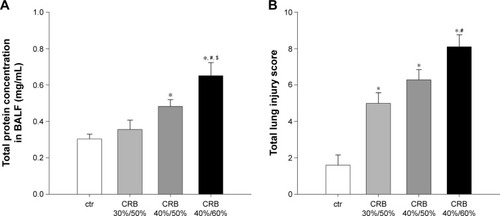
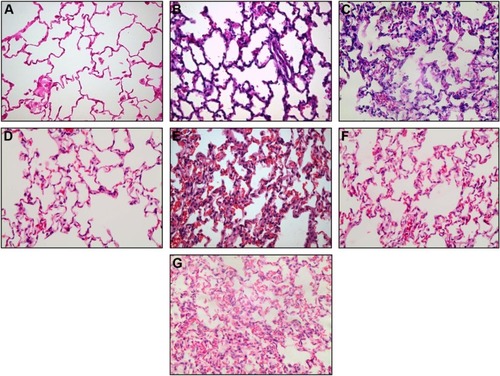
Figure 10 Representative histological sections (magnification ×400) from control (A), IRB 30% (B) and IRB 40% (C), ERB 40% (D) and ERB 70% (E), and CRB 30%/50% (F) and CRB 40%/60% (G) groups. Neutrophilic infiltration, capillary congestion, and focal thickening of the alveolar membrane are evident in lower resistive loads but are significantly more pronounced in the highest load of each group, especially CRB 40%/60%.