Figures & data
Table 1 Baseline clinical characteristics of COPD patients and control group
Table 2 The prevalence of positive Helicobacter pylori serology by COPD stage
Figure 1 Helicobacter pylori serum IgG levels in COPD patients and control subjects.
Note: Displayed as median ± IQR.
Abbreviations: IgG, immuno globulin G; IQR, interquartile range.
Abbreviations: IgG, immuno globulin G; IQR, interquartile range.
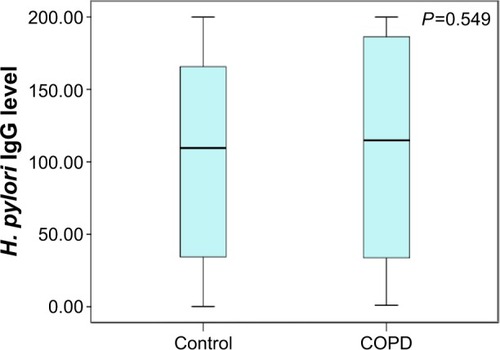
Table 3 The association of seropositivity of Helicobacter pylori and CLO tests
Figure 2 Correlation between Helicobacter pylo IgG titer and FEV1.
Notes: The distribution of H. pylori IgG titer according to the airflow limitation. Linear regression of the H. pylori IgG versus FEV1 (%). No significant correlation was found between two variables (n=187, r=−0.071, P=0.333).
Abbreviations: FEV1, forced expiratory volume in 1 second; IgG, immunoglobulin G.
Abbreviations: FEV1, forced expiratory volume in 1 second; IgG, immunoglobulin G.
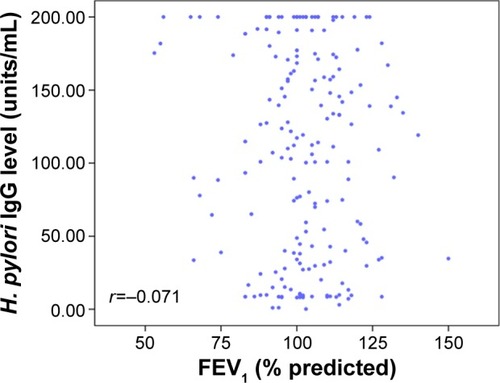
Table 4 Univariate and multivariate analysis of Helicobacter pylori seropositivity
Table 5 Impact of Helicobacter pylori test on the lung function decline
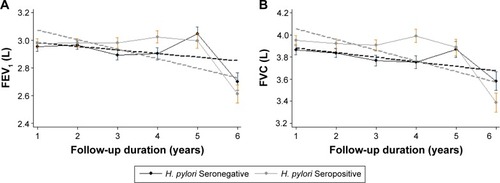
Figure 3 Impact of Helicobacter pylori seropositivity on lung function decline.
Notes: (A) FEV1 decline and (B) FVC decline.
Abbreviations: FEV1, forced expiratory volume in 1 second; FVC, forced vital capacity.
Abbreviations: FEV1, forced expiratory volume in 1 second; FVC, forced vital capacity.