
Figures & data
Table 1 Characteristics of COPD patients and non-COPD subjects
Figure 1 Correlations between the %CSA and an airflow limitation.
Abbreviations: %CSA, percentage of cross-sectional area; GOLD, Global Initiative for Chronic Obstructive Lung Disease; COPD, chronic obstructive pulmonary disease.
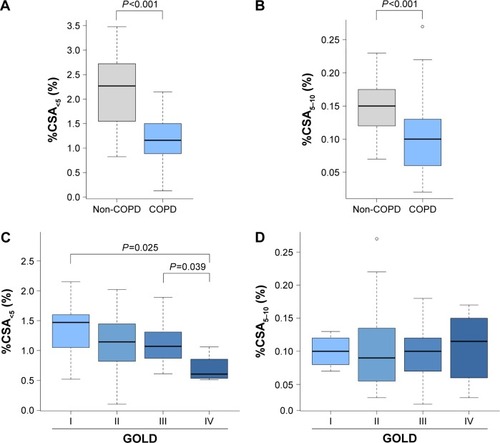
Table 2 Predictive values for severe AE-COPD
Table 3 Prediction of severe AE-COPD: univariate analyses
Figure 2 Cumulative incidence of severe acute AE-COPD according to the %CSA<5.
Abbreviations: AE-COPD, acute exacerbation of chronic obstructive pulmonary disease; %CSA, percentage of cross-sectional area.
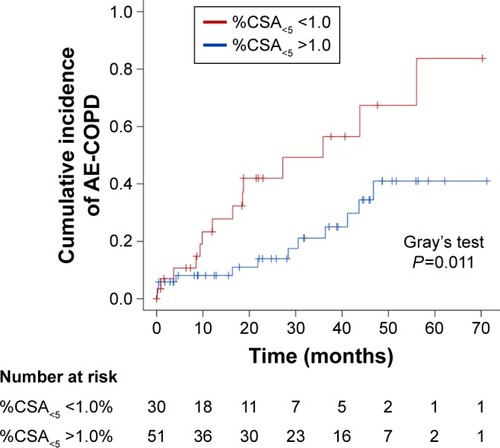
Figure S1 Extracting the pulmonary small vessels as the CSA.
Notes: (A) CT images of lung field segmented within the threshold values between −500 and −1,024 HU. (B) Binary images converted from segmented image (A) with a window level of −720 HU. Pulmonary vessels are displayed in black. (C) Mask image for particle analysis after setting vessel size parameters within 0–5 mm2 and the range of circularity within 0.9–1.0.
Abbreviations: CSA, cross-sectional area; CT, computed tomography; HU, Hounsfield units.
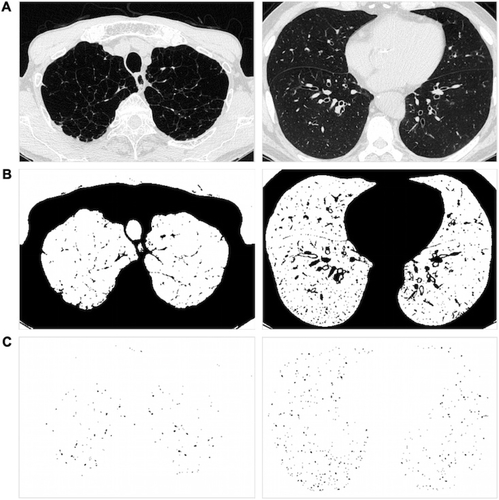
Figure S2 The relationships between the %CSA<5 and pulmonary functions.
Notes: The relationships between the %CSA<5 and the %FVC (A), %FEV1 (B), the FEV1/FVC (C), and the %LAV (D). ρ represents Spearman’s correlation coefficient.
Abbreviations: %CSA, percentage of cross-sectional area; %FVC, percent forced vital capacity; %FEV1, percent forced expiratory volume in 1 second; %LAV, percent low attenuation volume.
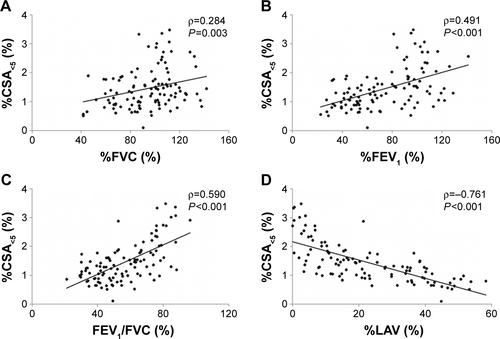
Figure S3 The relationships between the %CSA5–10 and pulmonary function parameters.
Notes: The relationships between the %CSA5–10 and the %FVC (A), %FEV1 (B), the FEV1/FVC (C), and the %LAV (D). ρ represents Spearman’s correlation coefficient.
Abbreviations: %CSA, percentage of cross-sectional area; %FVC, percent forced vital capacity; %FEV1, percent forced expiratory volume in 1 second; %LAV, percent low attenuation volume.
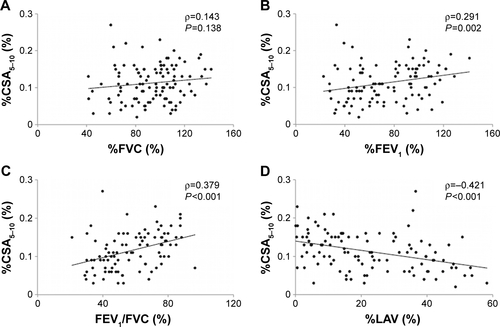
Table S1 Correlations between %CSA and clinical parameters
Table S2 Subgroup analyses of %CSA<5 and clinical determinants with severe AE-COPD