
Figures & data
Table 1 Characteristics of case and control subjects
Figure 1 Venn diagram that depicts the number of analytes overlapping between the two comparison groups.
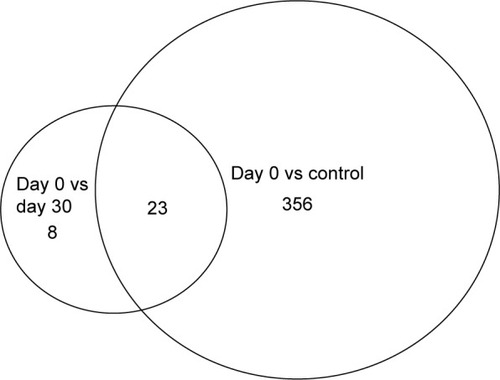
Figure 2 Analyte expression.
Notes: 25/34 of the analytes identified at 5% FDR that were differentially expressed comparing day 0 and day 30. Top number is retention time and bottom number is m/z. X-axis: C = control, d0 = day 0, d30 = day 30. Y-axis: peak intensity.
Abbreviations: FDR, false discovery rate; m/z, mass/charge.
Abbreviations: FDR, false discovery rate; m/z, mass/charge.
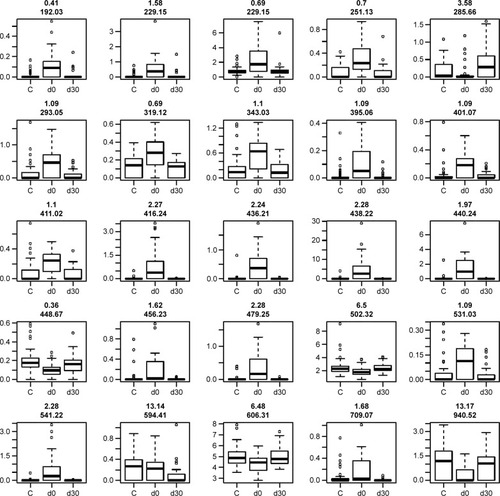
Figure 3 Tryptophan and kynurenine expression.
Notes: No statistically significant differences in tryptophan levels. Kynurenine levels were significantly lower at day 0 compared to day 30 (P=0.00292).
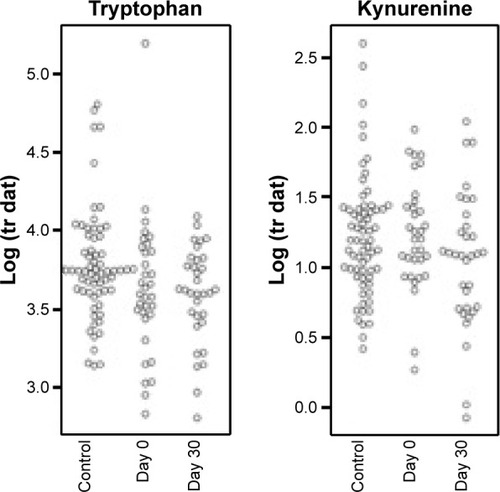
Figure 4 IDO activity as depicted by Kyn/Trp ratio.
Notes: Tryptophan and kynurenine levels were measured in plasma by SRM. Kyn/Trp values were significantly higher at day 0 compared to day 30 (P=0.0352) and higher at day 0 than in controls (P=0.0338).
Abbreviations: IDO, indoleamine 2,3-dioxygenase; SRM, selective reaction monitoring; Kyn/Trp, kynurenine/tryptophan.
Abbreviations: IDO, indoleamine 2,3-dioxygenase; SRM, selective reaction monitoring; Kyn/Trp, kynurenine/tryptophan.
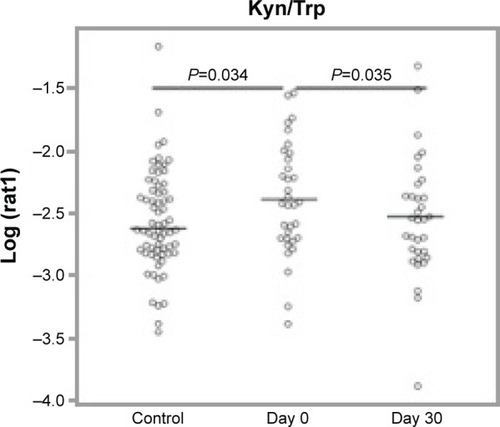
Table S1 Transitions for tryptophan and kynurenine
Table S2 Analytes differentially expressed comparing day 0 to day 30
Table S3 Analytes differentially expressed comparing day 0 to controls