
Figures & data
Table 1 Number of AAT determinations performed by year
Figure 1 Distribution of percentage of AAT determinations performed by age group.
Abbreviation: AAT, alpha-1 antitrypsin.
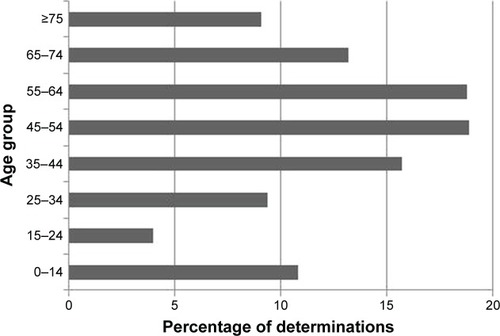
Table 2 Demographic characteristics and diseases related to AATD of children tested for AAT during the study period
Table 3 Comparison of the characteristics of adult patients tested for AAT during the study period according to AAT levels
Table 4 Six-month follow-up of adults tested for AATD according to AAT levels