Figures & data
Table 1 Mean changes and mean difference between absolute change in FEV1 on Day 1 and Day 10
Table 2 Difference in FEV1 response to albuterol and ipratropium between Day 1 and Day 10, stratified by specific thresholds
Figure 1 Response to albuterol on Day 1 compared with Day 10.
Abbreviation: FEV1, forced expiratory volume in 1 second.
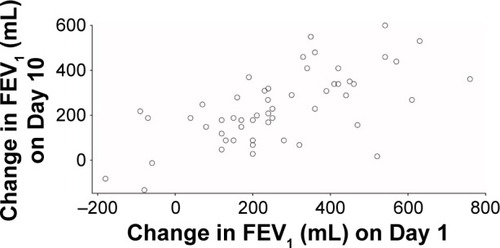
Figure 2 Change in FEV1 on Day 1 for albuterol and ipratropium.
Notes: Symbols demonstrate “reversibility” status on Day 10. Reversibility was defined as an increase in FEV1 of ≥12% and ≥200 mL following administration of albuterol or ipratropium. The square symbols represent patients whose reversibility status changed between Day 1 and Day 10.
Abbreviation: FEV1, forced expiratory volume in 1 second.
Abbreviation: FEV1, forced expiratory volume in 1 second.
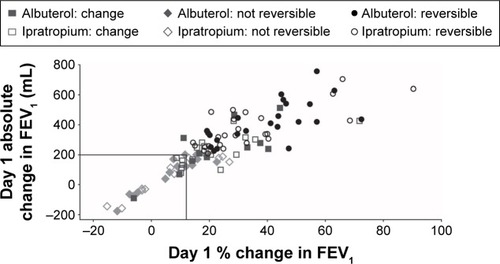
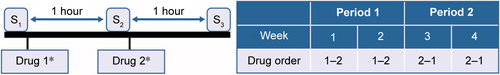
Figure S1 Schematic diagram of the study design.
Notes: *Drugs administered immediately after spirometry. S1: pre-dose spirometry; S2: spirometry 1 hour after drug 1; S3: spirometry 1 hour after drug 2.