
Figures & data
Figure 1 OTEMTO® (1237.5 [NCT1431274] + 1237.6 [NCT1431287]) and TONADO® (1237.25 [NCT1964352] + 1237.26 [NCT2006732]) study designs.
Note:
aPrimary end point assessment.
Abbreviations: O, olodaterol; R, randomization; T, tiotropium.
Abbreviations: O, olodaterol; R, randomization; T, tiotropium.
![Figure 1 OTEMTO® (1237.5 [NCT1431274] + 1237.6 [NCT1431287]) and TONADO® (1237.25 [NCT1964352] + 1237.26 [NCT2006732]) study designs.](/cms/asset/4f28cadd-4f96-4c55-9edb-cfbcb8a3393a/dcop_a_108758_f0001_b.jpg)
Table 1 Baseline patient demographics by age group
Figure 2 FEV1 AUC0–3 response (A) and trough FEV1 response (B) by age group after 12 weeks (OTEMTO®) and 24 weeks (TONADO®).
Abbreviations: AUC0–3, area under the curve from 0 hour to 3 hours; FEV1, forced expiratory volume in 1 second; O, olodaterol; SE, standard error; T, tiotropium.
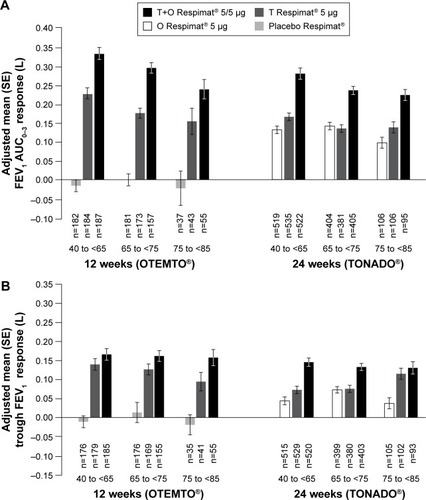
Figure 3 Impact of treatment on FEV1 AUC0–3 response (A) and trough FEV1 response (B) by age group after 12 weeks (OTEMTO®) and 24 weeks (TONADO®).
Abbreviations: AUC0–3, area under the curve from 0 hour to 3 hours; CI, confidence interval; FEV1, forced expiratory volume in 1 second; O, olodaterol; T, tiotropium.
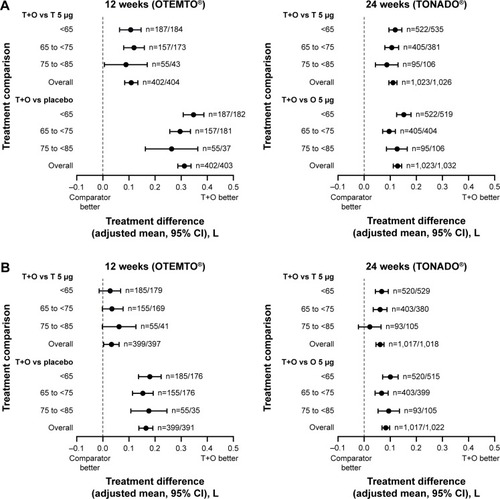
Table 2 Summary of AEs by age group