Figures & data
Table 1 COPD patients’ clinical characteristics
Table 2 HRV indices at rest and during the RSA maneuver
Figure 1 Moderate-to-strong correlations were found between PImax and PEmax, and spectral HRV indices during the RSA-M.
Notes: (A) Negative correlation between LF (nu) and PImax (cm H2O); (B) negative correlation between LF (nu) and PEmax (cm H2O); (C) positive correlation between HF (nu) and PImax (cm H2O); (D) Positive correlation between HF (nu) and PEmax (cm H2O). The Spearman’s correlation analysis was performed. Significance level: P≤0.05.
Abbreviations: HRV, heart rate variability; RSA-M, respiratory sinus arrhythmia maneuver; HF, power in the high-frequency band; LF, power in the low-frequency band; PImax, maximum inspiratory pressure; PEmax, maximum expiratory pressure; nu, normalized units; cm H2O, centimeters of water.
Abbreviations: HRV, heart rate variability; RSA-M, respiratory sinus arrhythmia maneuver; HF, power in the high-frequency band; LF, power in the low-frequency band; PImax, maximum inspiratory pressure; PEmax, maximum expiratory pressure; nu, normalized units; cm H2O, centimeters of water.
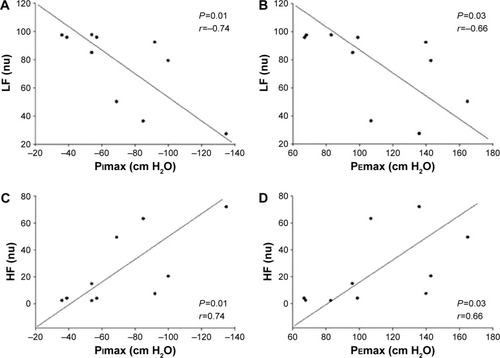
Table 3 Linear regression analysis to predict LF from PImax, during the RSA-M
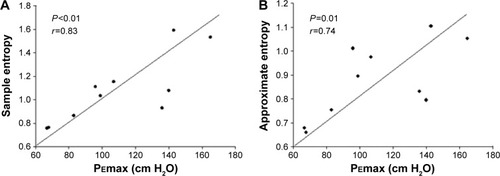
Figure 2 Strong correlations were also observed between HRV complexity indices (ApEn and SampEn) and PEmax during the RSA-M.
Notes: (A) Positive correlation between SampEn and PEmax (cm H2O); (B) Positive correlation between ApEn and PEmax (cm H2O). The Spearman’s correlation analysis was performed. Significance level: P≤0.05.
Abbreviations: HRV, heart rate variability; RSA-M, respiratory sinus arrhythmia maneuver; PEmax, maximum expiratory pressure; SampEn, sample entropy; ApEn, approximate entropy; cm H2O, centimeters of water.
Abbreviations: HRV, heart rate variability; RSA-M, respiratory sinus arrhythmia maneuver; PEmax, maximum expiratory pressure; SampEn, sample entropy; ApEn, approximate entropy; cm H2O, centimeters of water.