Figures & data
Figure 1 Generation of TNF-tg × TNFR1−/−, TNF-tg × TNFR2−/−.
Abbreviations: PCR, polymerase chain reaction; tg, transgene; TNF-α, tumor necrosis factor-α; TNF-tg, TNF-α transgene; TNFR, TNF receptor; wt, wild type.
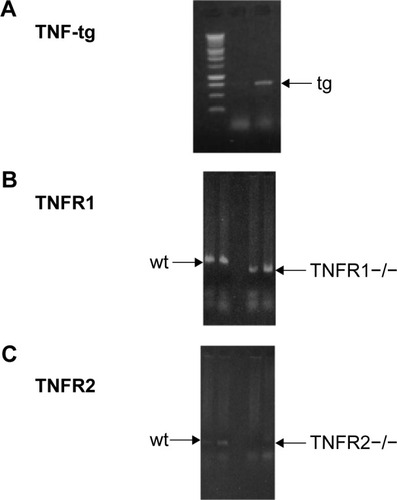
Table 1 Mice used in this experiment
Figure 2 Macroscopic lung findings.
Abbreviations: TNF-α, tumor necrosis factor-α; TNF-tg, TNF-α transgene; TNFR, TNF receptor.
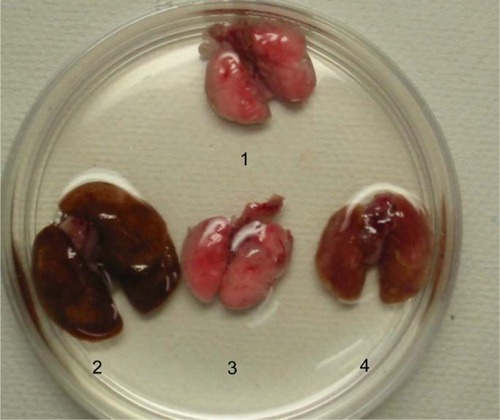
Figure 3 Histology of the lungs.
Notes: Lung sections from the mice were stained with hematoxylin–eosin (H–E). All panels are at the same magnification. Original magnification, 40×. The lungs from wild-type mice (C57BL/6), TNFR1−/−, TNFR2−/−, TNF-tg, TNF-tg × TNFR1−/−, and TNF-tg × TNFR2−/−. There is no histological difference between wild-type mice (C57BL/6), TNFR1−/−, and TNFR2−/− (top panel). TNF-tg showed alveolar enlargement and interstitial inflammation. The degree of involvement was consistent with the macroscopic findings. The histology of lungs from TNF-tg × TNFR1−/− mice was similar to that of wild-type mice (C57BL/6) and TNFR1−/−.
Abbreviations: TNF-α, tumor necrosis factor-α; TNF-tg, TNF-α transgene; TNFR, TNF receptor.
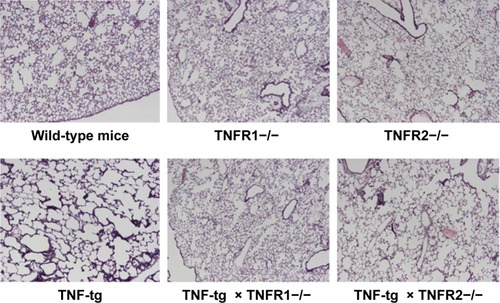
Figure 4 Investigation of emphysema by morphometry and physiologic study.
Abbreviations: Lm, mean linear intercept; NS, no significance; P–V, pressure–volume; tg, transgene; TNF-α, tumor necrosis factor-α; TNF-tg, TNF-α transgene; TNFR, TNF receptor.
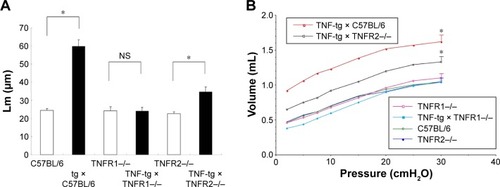
Figure 5 Analysis of BAL fluids.
Abbreviations: BAL, bronchoalveolar lavage; TNF-α, tumor necrosis factor-α; TNF-tg, TNF-α transgene; TNFR, TNF receptor.
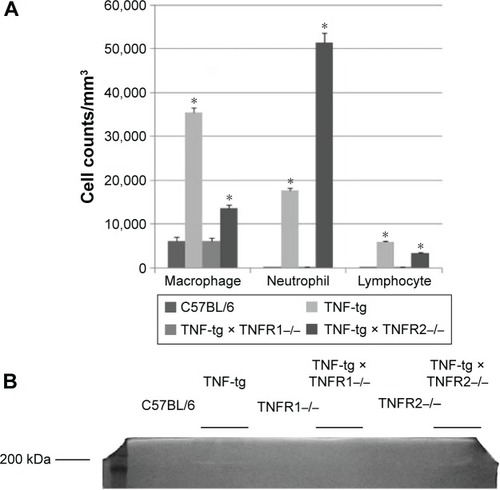
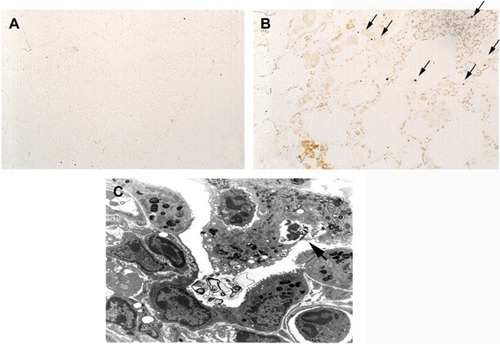
Figure 6 Apoptosis in COPD pathogenesis.
Abbreviations: TNF-α, tumor necrosis factor-α; TNF-tg, TNF-α transgene; TUNEL, Tdt nick-end labeling.