
Figures & data
Table 1 Baseline characteristics of the study population
Figure 1 Flowchart of recruitment.
Abbreviation: PAM, Patient Activation Measure.
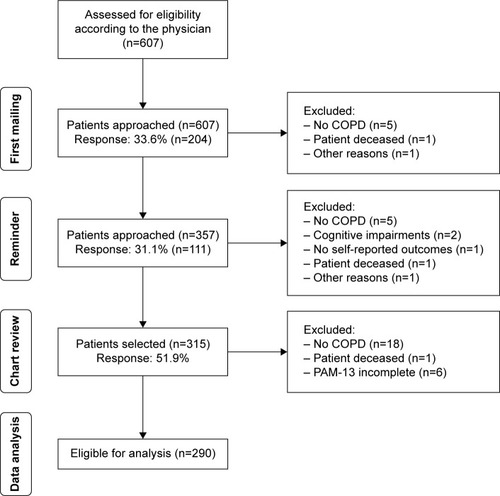
Figure 2 Distribution of different PAM levels.
Notes: Level 1 (≤47.0): Disengaged and overwhelmed: Individuals are passive and lack confidence. Knowledge is low, goal-orientation is weak, and adherence is poor. Level 2 (47.1–55.1): Becoming aware, but still struggling: Individuals have some knowledge, but large gaps remain. They believe health is largely out of their control, but can get simple goals. Level 3 (55.2–67.0): Taking action: Individuals have the key facts and are building self-management skills. They strive for the best practice behaviors and are goal-oriented. Level 4 (≥67.1): Maintaining behaviors and pushing further: Individuals have adopted new behaviors, but may struggle in times of stress or change. Maintaining a healthy lifestyle is a key focus. Description of PAM levels is cited from http://www.insigniahealth.com.Citation23
Abbreviation: PAM, Patient Activation Measure.
Abbreviation: PAM, Patient Activation Measure.
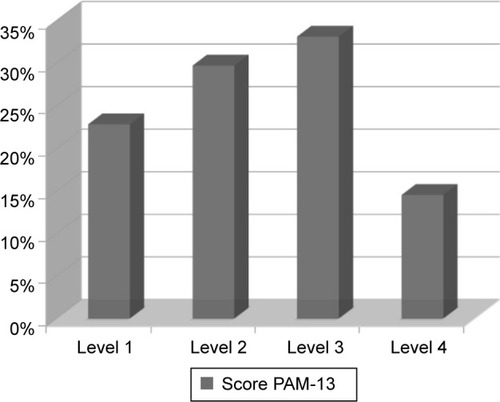
Table 2 Univariate linear regression and multiple linear regression to analyze the association between multiple determinants and activation for self-management