Figures & data
Table 1 Demographic properties of the females eliminated from the study
Figure 1 People are exposed to heavy smoke due to the cooking conditions (lack of chimney and poor ventilation).
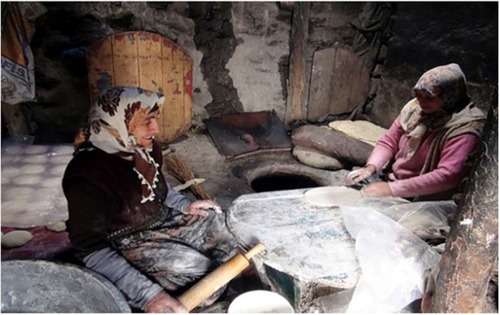
Figure 2 Dry animal dung (manure), rather than wood or charcoal, is used as the fuel source.
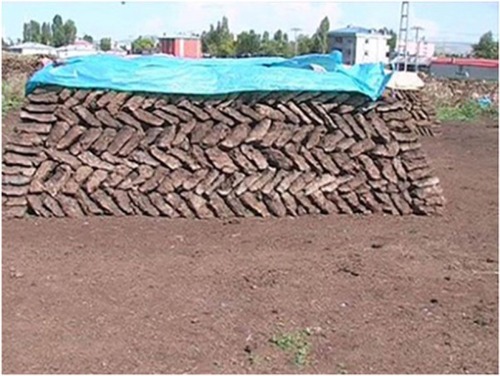
Table 2 PFT values of the study group and the control group
Figure 3 The difference of FEF 25–75 (A), FEV1/FVC (B), FEV1 (C), and FVC (D) results between the study group and control group.
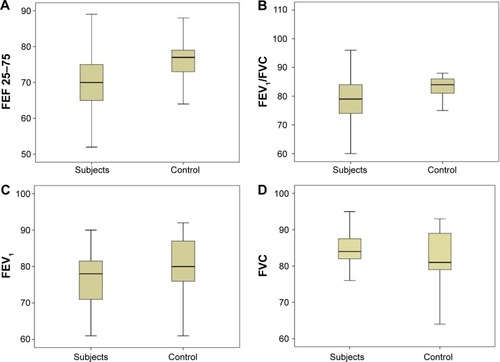
Table 3 Pathologic PFT results in the study group and control group
Table 4 Median values of the evaluated parameters in the study group (N=115)
Table 5 Determination of the risk factors for the altered PFT results
Table 6 Correlation analysis between PFT results and independent variables in the study group
Figure 4 ROC curves of duration with small, obstructive, and restrictive airway diseases.
Abbreviation: ROC, receiver operating characteristic.
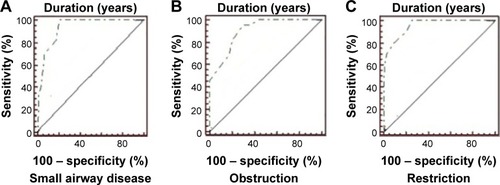
Table 7 Median values of CEI among biomass exposed women, who had altered and normal PFT results
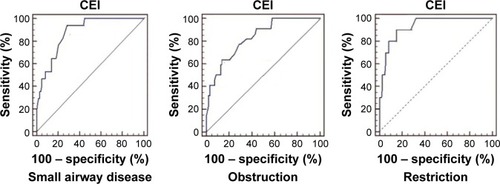
Table 8 Cutoff values of CEI for small airway disease, obstruction, and restriction
Figure 5 The difference of median values of CEI among all biomass exposed women based on PFT results.
Notes: The difference of CEI among all biomass exposed women with and without (A) small airway disease; (B) obstruction; and (C) restriction. Circles and stars indicate the cases out of 95% CI.
Abbreviation: CEI, cumulative exposure index.
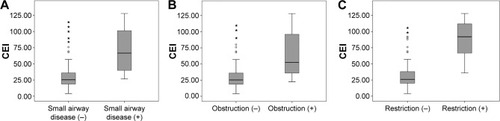
Figure 6 ROC curve analysis of CEI for small airway disease and obstructive and restrictive pulmonary diseases.