Figures & data
Figure 1 Hyperoxia exposure decreases body weight in neonatal mice.
Abbreviation: SD, standard deviation.
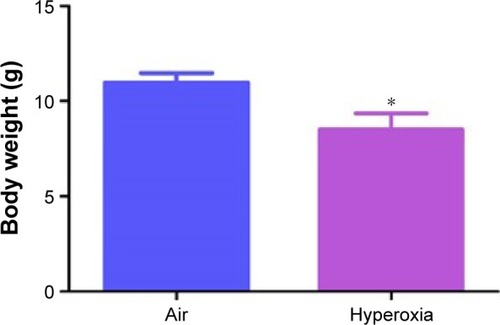
Figure 2 Hyperoxia exposure increases lung MDA protein levels.
Notes: Lung protein obtained from neonatal mice exposed to air or hyperoxia for 14 days was subjected to immunoblotting using anti-MDA or -β-actin antibodies. Representative immunoblot showing differential MDA protein adduct expression in the region between 40 and 80 kDa (A). Densitometric analysis wherein the aforementioned MDA protein adduct band intensities were quantified and normalized to β-actin (B). Values are mean ± SD from four individual animals in each group from one experiment. Significant differences between air and hyperoxia groups are indicated by *P<0.05.
Abbreviations: MDA, malondialdehyde; SD, standard deviation.
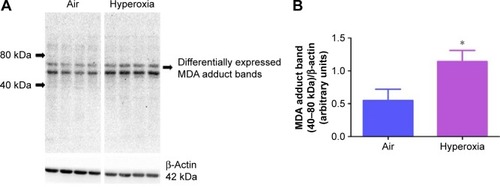
Figure 3 Hyperoxia exposure increases lung iNOS protein levels.
Abbreviations: iNOS, inducible nitric oxide synthase; SD, standard deviation.
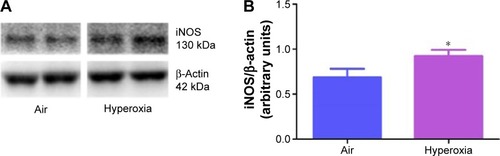
Figure 4 Hyperoxia exposure induces alveolar simplification.
Abbreviations: WT, wild type; RAC, radial alveolar count; MLI, mean linear intercept; SD, standard deviation.
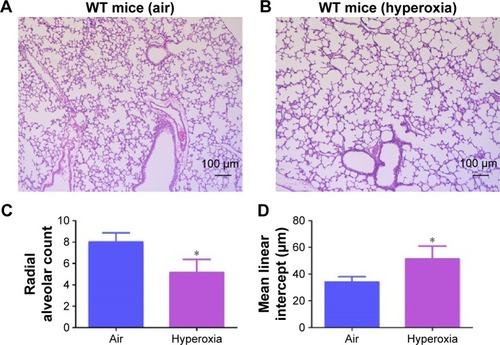
Figure 5 Hyperoxia exposure decreases pulmonary vascular density.
Abbreviations: WT, wild type; vWF, von Willebrand factor; SD, standard deviation.
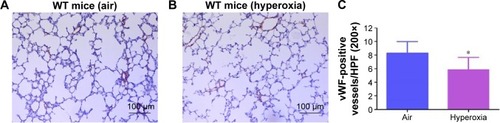
Figure 6 Hyperoxia exposure induces pulmonary vascular remodeling.
Abbreviations: WT, wild type; α-SMA, alpha smooth muscle actin; SD, standard deviation.
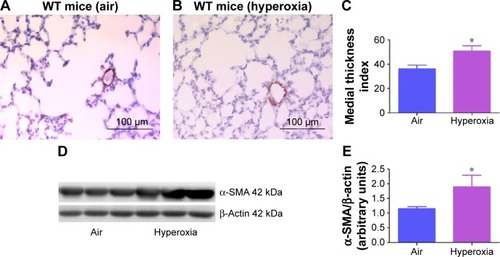
Figure 7 Hyperoxia exposure induces PH.
Notes: Representative PWD Echo recording of PA blood flow obtained at 14 days of age from neonatal mice exposed to air (A) or hyperoxia (B). PAT (C) and PAT/ET ratio (D) were estimated from the PWD Echo recordings of the PA blood flow. Values are mean ± SD from four individual animals in each group from one experiment. Significant differences between air and hyperoxia groups are indicated by *P<0.05.
Abbreviations: PWD, pulsed-wave Doppler; Echo, echocardiography; PA, pulmonary artery; PAT, pulmonary acceleration time; ET, ejection time; SD, standard deviation; PH, pulmonary hypertension.
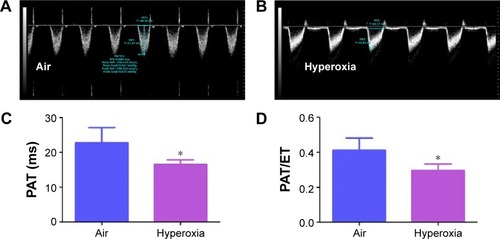
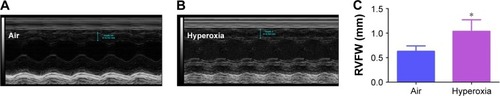
Figure 8 Hyperoxia exposure induces RVH.
Abbreviations: RVH, right ventricular hypertrophy; RVFW, right ventricular free wall; Echo, echocardiography; SD, standard deviation.