Figures & data
Table 1 Sequence of the primers used for validation of selected lncRNAs
Table 2 Clinical characteristics of the subjects involved in the studies
Table 3 Analysis of differentially expressed lncRNAs and mRNAs between COPD and non-COPD lung tissues
Figure 1 The expression of lncRNAs and mRNAs in COPD lung tissues. (A) The percentage of differentially expressed lncRNAs in COPD lung tissues compared with non-COPD lung tissues. (B) The percentage of differentially expressed mRNAs in COPD lung tissues relative to non-COPD lung tissues. (C) The hierarchical clustering of differentially expressed lncRNAs, which are displayed on a scale from green (low) to red (high), between COPD and non-COPD lung tissues. (D) Heat map of distinguishable mRNA expression amid lung tissues samples; red shows relatively high expression and green shows relatively low expression.
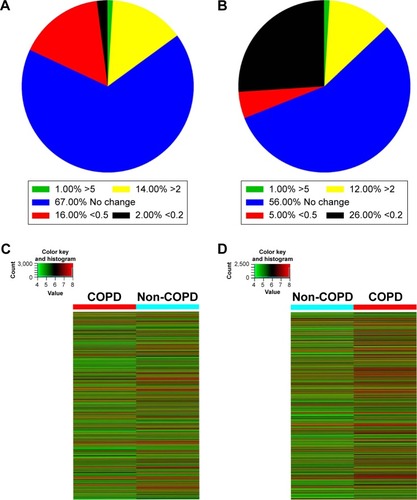
Table 4 The proportion of differentially expressed lncRNAs in COPD lung tissues based on genomic locus position
Figure 2 KEGG pathway analysis of the differentially expressed mRNAs. (A) Pathway analysis demonstrates the significant pathways of differentially down-regulated mRNAs in model vs normal group. The P-value (EASE-score, Fisher’s P-value, or hypergeometric P-value) denotes the significance of the pathway correlated to the conditions. The lower the P-value, more significant is the pathway (the recommended P-value cutoff is 0.05). (B) Differentially up-regulated mRNAs in model vs normal group.
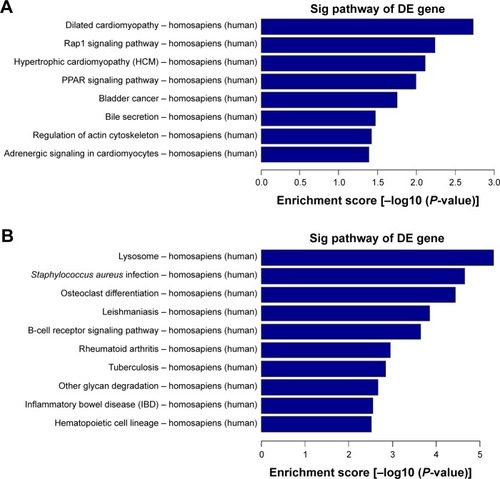
Figure 3 Gene ontology (GO) enrichment analysis of the differentially down-expressed mRNAs. (A) GO biological process classification for biological process of down-regulated mRNAs. (B) GO biological process classification for cellular components of differentially down-expressed mRNAs. (C) GO biological process classification for molecular function of differentially down-expressed mRNAs. (D) GO analysis indicates the top 10 counts of enrichment score in the biological process of down-regulated mRNAs. (E) GO analysis indicates the top 10 counts of enrichment score in cellular components of down-regulated mRNAs. (F) GO analysis indicates the top 10 counts of enrichment score in molecular function of down-regulated mRNAs.
Abbreviation: Sig, significant.
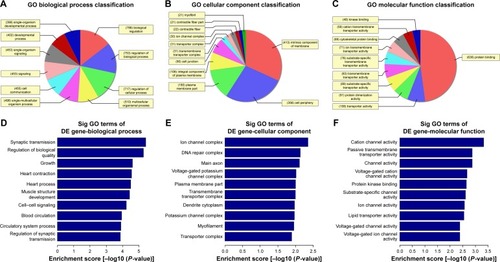
Figure 4 Gene ontology (GO) enrichment analysis of the differentially up-expressed mRNAs. (A) GO biological process classification for biological process of up-regulated mRNAs. (B) GO biological process classification for cellular components of differentially up-expressed mRNAs. (C) GO biological process classification for molecular function of differentially up-expressed mRNAs. (D) GO analysis indicates the top 10 counts of enrichment score in biological process of up-regulated mRNAs. (E) GO analysis indicates the top 10 counts of enrichment score in cellular components of up-regulated mRNAs. (F) GO analysis indicates the top 10 counts of enrichment score in molecular function of up-regulated mRNAs.
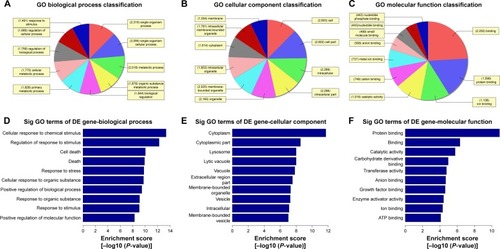
Table 5 Detailed information of significant differentially expressed lncRNAs in diseases
Figure 5 Ten differentially expressed lncRNAs are identified. (A) The relative expression levels of 10 differentially up-regulated lncRNAs in COPD lung tissues compared with non-COPD lung tissues (n=20) were measured by qRT-PCR. (B) The relative expression levels of 10 differentially down-regulated lncRNAs beween COPD and non-COPD lung tissues (n=20) were detected by qRT-PCR. GAPDH served as the control for RNA loading (*P<0.05; **P<0.01; ***P<0.001).
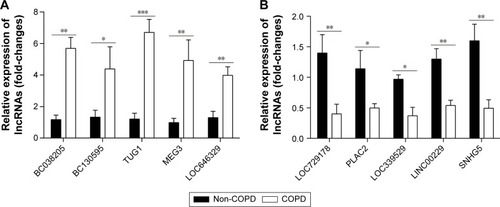
Figure 6 Silencing of TUG1 affects the proliferation ability of BEAS-2B and HFL1 cells after TGF-β pretreatment. (A) The relative expression levels of lncRNAs TUG1 in BEAS-2B cells were measured by qRT-PCR (**P<0.01). (B) The relative expression levels of lncRNAs TUG1 in HFL1 cells were measured by qRT-PCR (**P<0.01). (C) The capacity of proliferation was detected with CCK-8. About 50 μM of NC siRNAs or TUG1 siRNAs (si-TUG1) were transfected into BEAS-2B cells for 48 h. Silencing of TUG1 expression by siRNA promoted the capacity to proliferation in BEAS-2B cells. TGF-β (2 ng/mL) was treated for 48 h. TGF-β inhibited the capacity to proliferate. #P<0.05 as compared with BEAS-2B cells treated with 50 μM NC siRNAs and TGF-β (2 ng/mL); *P<0.05 as compared with BEAS-2B cells. (D) The capacity to proliferate was also detected using CCK-8 assay. Silencing of TUG1 expression by siRNA promoted the capacity of proliferation. TGF-β inhibited the capacity of proliferation in HFL1 cells. #P<0.05 as compared with HFL1 cells treated with 50 μM NC siRNAs and TGF-β (2 ng/mL); *P<0.05 as compared with HFL1 cells.
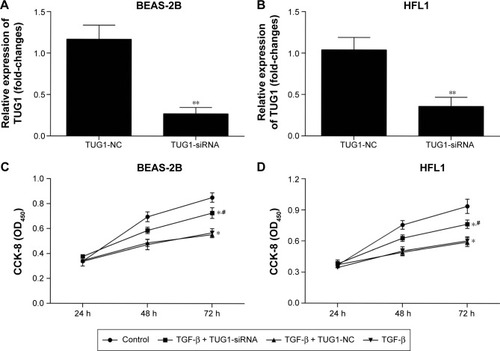
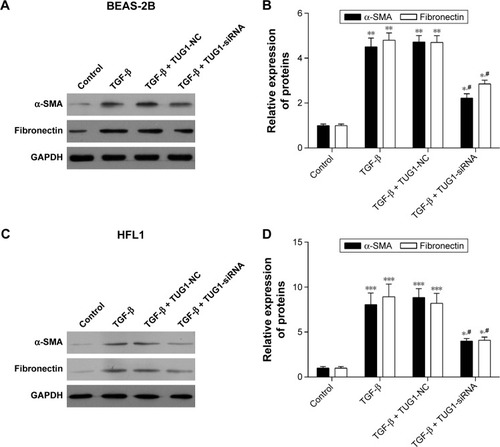
Figure 7 Silencing of TUG1 suppresses the expression levels of α-SMA and fibronectin proteins in BEAS-2B and HFL1 cells. (A) Silencing of TUG1 expression by siRNA inhibited the expression levels of α-SMA and fibronectin proteins, while TGF-β promoted the expression levels of α-SMA and fibronectin proteins. About 50 μM negative control (NC) siRNAs or TUG1 siRNAs (si-TUG1) and 2 ng/mL TGF-β were transfected into BEAS-2B cells for 48 h. The expression levels of α-SMA and fibronectin proteins were detected by Western blot in BEAS-2B cells. (B) Gray statistical analysis of the expression levels of α-SMA and fibronectin proteins in BEAS-2B cells. #P<0.05 as compared with BEAS-2B cells treated with 50 μM NC siRNAs and TGF-β (2 ng/mL); *P<0.05 as compared with BEAS-2B cells. **P<0.01. (C) The expression levels of α-SMA and fibronectin proteins were detected by Western blot in HFL1 cells treated as mentioned earlier. GAPDH was used for internal control. (D) Gray statistical analysis of the expression levels of α-SMA and fibronectin proteins in HFL1 cells. #P<0.05 as compared with HFL1 cells treated with 50 μM NC siRNAs and TGF-β (2 ng/mL); *P<0.05 as compared with HFL1 cells. ***P<0.001.