Figures & data
Table 1 Characteristics of patients
Figure 1 Differences in PA duration according to the mMRC grade.
Notes: Kruskal–Wallis test and post hoc Dunn’s multiple comparison test were used for the comparison of PA durations according to the mMRC grade. Data are shown as a box plot (lower and upper extreme of the box represent the 25th and the 75th percentiles, respectively, and the central line represents the median). The lower and upper vertical lines represent the 5th and 95th percentiles, respectively. #P<0.05 versus mMRC grade 1. A: PA at ≥2 METs; B: PA at ≥22.5 METs; C: PA at ≥23 METs; D: PA at ≥23.5 METs.
Abbreviations: PA, physical activity; mMRC, modified Medical Research Council; METs, metabolic equivalents; min, minutes.
Abbreviations: PA, physical activity; mMRC, modified Medical Research Council; METs, metabolic equivalents; min, minutes.
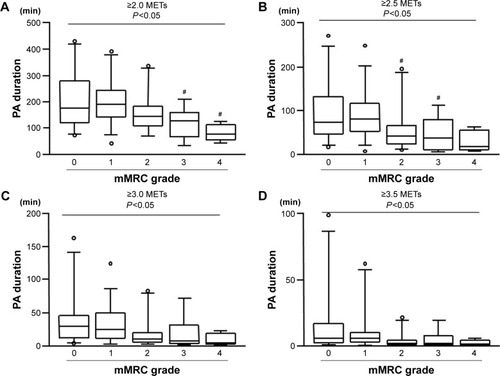
Figure 2 Differences in PAL at ≥3 METs according to the mMRC grade.
Notes: Kruskal–Wallis test and post hoc Dunn’s multiple comparison test were used for the comparison of PA durations according to the mMRC grade. Data are shown as a box plot (lower and upper extreme of the box represent the 25th and the 75th percentiles, respectively, and the central line represents the median). The lower and upper vertical lines represent the 5th and 95th percentiles, respectively.
Abbreviations: PAL, physical activity level; mMRC, modified Medical Research Council; PA, physical activity; METs, metabolic equivalents; h, hour.
Abbreviations: PAL, physical activity level; mMRC, modified Medical Research Council; PA, physical activity; METs, metabolic equivalents; h, hour.
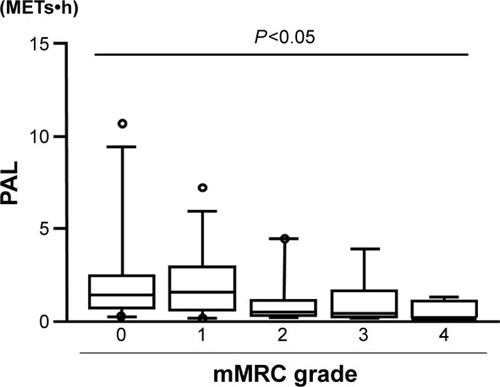
Figure 3 mMRC grade and the proportion of patients with low PAL.
Notes: Chi-square test was used for comparison between mMRC grades and the proportion of patients with low PAL. *P<0.05 versus mMRC grade 0, #P<0.05 versus mMRC grade 1.
Abbreviations: mMRC, modified Medical Research Council; PAL, physical activity level.
Abbreviations: mMRC, modified Medical Research Council; PAL, physical activity level.
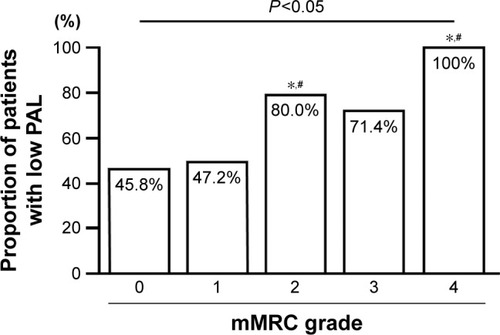
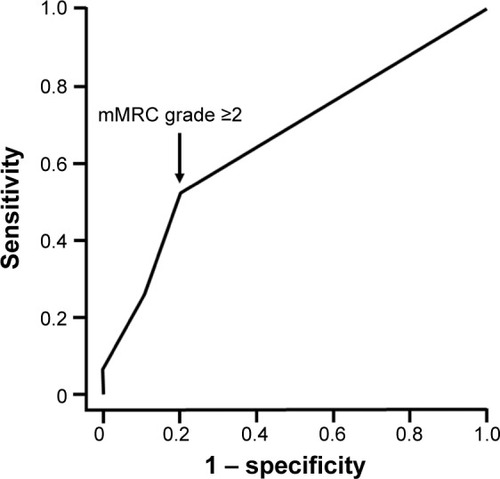
Figure 4 ROC curve for identifying patients with low PAL.
Notes: mMRC grade ≥2 was the most balanced cutoff point and yielded 51.7% sensitivity and 80.0% specificity (area under curve =0.66).
Abbreviations: mMRC, modified Medical Research Council; PAL, physical activity level; ROC, receiver operating characteristic.
Abbreviations: mMRC, modified Medical Research Council; PAL, physical activity level; ROC, receiver operating characteristic.