Figures & data
Figure 1 Bronchial wall thickness measurement in high-resolution CT scan.
Abbreviations: CT, computed tomography; I/O ratio, inner to outer diameter ratio; SD, standard deviation; W, width; H; height; Min, minimum; Max, maximum; T/D ratio, bronchial wall thickness to outer diameter ratio.
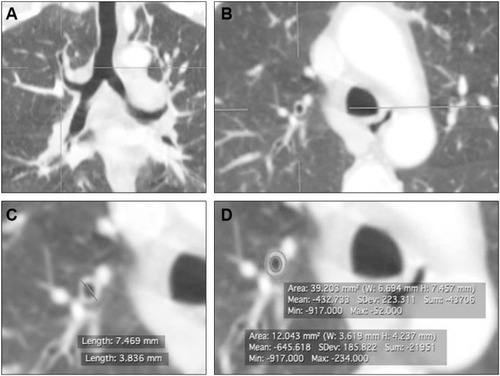
Table 1 Baseline characteristics of the study population
Table 2 Clinical and functional characteristics of COPD according to GOLD scores
Figure 2 The different grades of endobronchial erythema identified by HD WLB (A–E) and i-scan3 (F, H–K).
Notes: A and F show decreased erythema (H–J); B and H show normal erythema (G0); C and I show mild erythema (G+1); D and J show moderate erythema (G+2); and E and K show severe erythema (G+3).
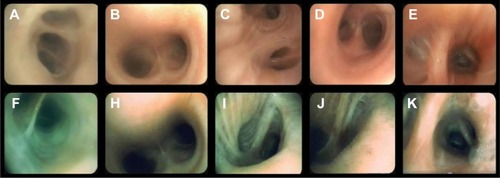
Figure 3 HD WLB (A–C) and i-scan3 (D–F) showing various endobronchial mucosal changes.
Notes: A and D show mucosal striations (arrowheads), edema, and stoma; B and E show mucosal nodules (arrows); and C and F show mucosal thinning (stars).
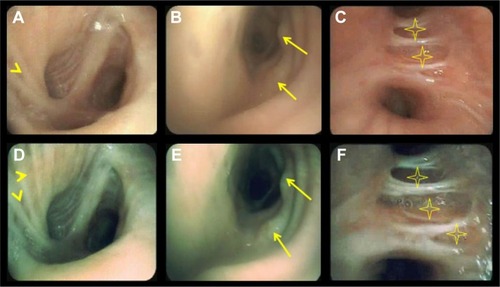
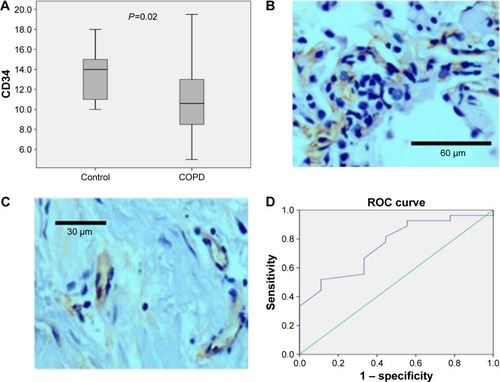
Figure 4 Endobronchial mucosal microvasculature in COPD and controls.
Abbreviation: ROC, receiver operating characteristic.