
Figures & data
Table 1 Outcomes and measures
Figure 1 Flowchart depicting flow of participants through the study.
Abbreviations: COPD, chronic obstructive pulmonary disease; PR, pulmonary rehabilitation.
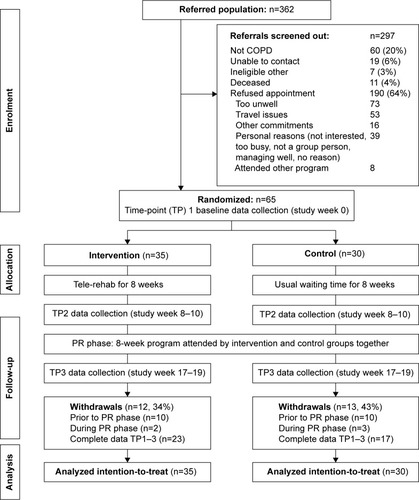
Table 2 Participant characteristics
Table 3 Baseline outcomes: intervention versus control group
Table 4 Changes in outcomes between groups: intervention group versus control group
Table 5 Comparison of two 6-minute walk test distances conducted 30 minutes apart at different time-points
Table 6 Walking diary data: intervention versus controls; exercise attendees versus nonattendees