Figures & data
Table 1 Demographic and clinical characteristics of study subjects
Figure 1 Emphysematous holes identified and measured in volumetric CT of a subject during inspiration and expiration.
Notes: (A) Inspiratory CT image of a subject, showing low-attenuation masks (>−950 HU; EIins% 13.79). (B) Low-attenuation masks of expiratory CT of the same subject (EIexp% 1.57). (C) Three-dimensional visualization of emphysematous holes in A with size-based color coding. (D) Three-dimensional visualization of emphysematous holes in B with size-based color coding. (E) Distributions of emphysematous hole sizes in inspiratory and expiratory CT scans of the same subject as in A–D on cumulative log–log scale. The size distribution followed a power law with exponents Dins =4.70 (R2=0.97) and Dexp =4.90 (R2=0.96).
Abbreviations: CT, computed tomography; HU, Hounsfield units; EI, emphysema index; ins, inspiration; exp, expiration; D, power-law exponents.
Abbreviations: CT, computed tomography; HU, Hounsfield units; EI, emphysema index; ins, inspiration; exp, expiration; D, power-law exponents.
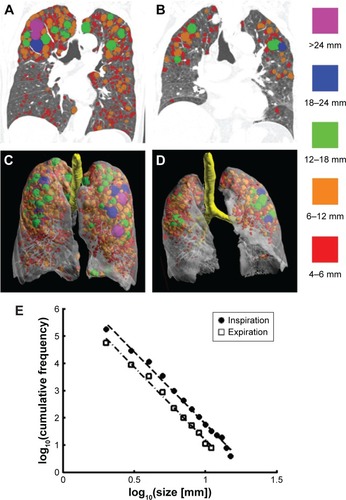
Figure 2 Effects of inspiration and expiration on (A) EI%s and (B) Ds.
Abbreviations: EI, emphysema index; D, power-law exponent.
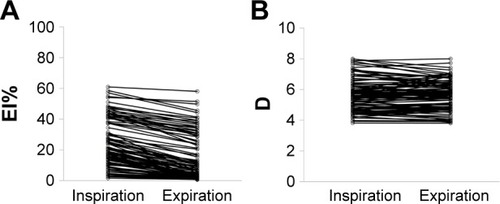
Figure 3 Bland–Altman plots of the robustness of D and EI% to breath-hold levels.
Notes: (A) EI% measured during inspiratory and expiratory CT scans; the mean difference was 9.8%. (B) D measured during inspiratory and expiratory CT scans; the mean difference was 0.022.
Abbreviations: EI, emphysema index; CT, computed tomography; SD, standard deviation; D, power-law exponents; ins, inspiration; exp, expiration.
Abbreviations: EI, emphysema index; CT, computed tomography; SD, standard deviation; D, power-law exponents; ins, inspiration; exp, expiration.
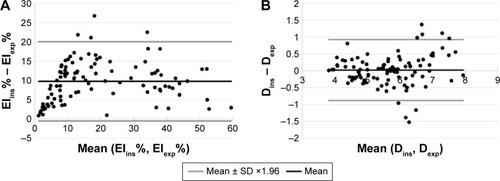
Table 2 Associations of Dins with post-BD FEV1 (%pred), cDLCO (%pred), 6MWD, SGRQ score, and EIins%
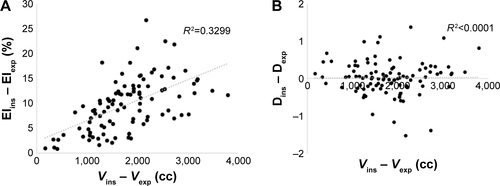
Figure S1 EI% differences (A) were affected by the lung volume changes but D differences (B) were not.
Abbreviations: EI, emphysema index; D, power-law exponents; ins, inspiration; exp, expiration; V, lung volume.